To all, I wish you happy holidays, and a viable New Year.
My favorite blogging opportunity this year was being able to mess around with Javascript and scientific graphics. It's colorful, but I hope that it does convey a lot of information in a fairly small space. Anyway that's the aim.
So I've overhauled the gallery of examples during the year that I maintain. It's no longer practical to have these all on one page, so I've made separate pages, with a tableau of images you can click on to reach them. The gallery is here, but I'm showing the tableau below.
Finally, I guess I should provide something Christmassy. Here's Enya:
Saturday, December 24, 2011
Tuesday, December 20, 2011
November GISS is out - down 0.07°C from October
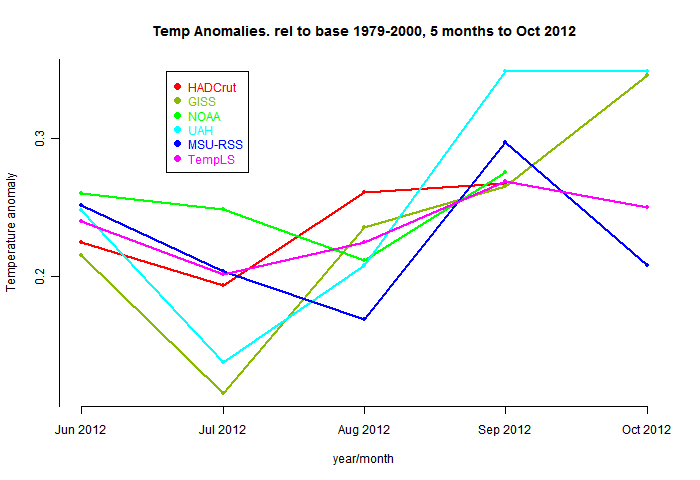
The other surface indices were in notable unison. TempLS was down by 0.124°C, NOAA by 0.13°C and HADCrut by 0.122°C. Satellites showed less change. Here's the plot:
I had been using the GISS index based on V2 of GHCN, but that was discontinued this month. This caused a few days delay as my script, looking at the V2 file, said there was no change. There doesn't seem to be any great discontinuity caused by the change. Of course I'll be using the V3 version in the future.
Below the jump I'll show the comparison of the GISS and TempLS spatial distributions. This month I did another much more detailed spatial distribution based directly on station readings.
Here is the GISS plot of temperature distribution for November 2011:
And here is the TempLS version, using the GISS base years and levels.colors. I use a standard scale, and this is the first time I have overrun - the white patch over the Caucasus. I was reassured to find that GISS also used it's extreme color there. I did the map fairly this month (about 8th) but it still works fairly well.
September
August
More data and plots
I had been using the GISS index based on V2 of GHCN, but that was discontinued this month. This caused a few days delay as my script, looking at the V2 file, said there was no change. There doesn't seem to be any great discontinuity caused by the change. Of course I'll be using the V3 version in the future.
Below the jump I'll show the comparison of the GISS and TempLS spatial distributions. This month I did another much more detailed spatial distribution based directly on station readings.
Here is the GISS plot of temperature distribution for November 2011:
And here is the TempLS version, using the GISS base years and levels.colors. I use a standard scale, and this is the first time I have overrun - the white patch over the Caucasus. I was reassured to find that GISS also used it's extreme color there. I did the map fairly this month (about 8th) but it still works fairly well.
Previous Months
OctoberSeptember
August
More data and plots
Monday, December 19, 2011
Significant trends in Foster/Rahmstorf
Having recently finished a post on trends in unadjusted temperature indices, I see that Tamino has posted his code and results for the indices after adjustment for known exogenous effects.
This is of great interest to the kind of study I was doing. There the variations were assumed random, and assessed for significance on that basis. But of course we don't know they are random - it's just an model in the absence of better information. F&R have used more information, so I want to see what the effect is.
First a review of the methods. Some posts starting here looked at the pattern of temperature trends you could create with all possible start and end points over a period. Then I looked at how allowance for statistical significance changed the picture, and then at how a similar picture could be drawn of upper and lower CI's.
I want to show principally the latter analysis. Here's an example which will be enlarged later:
On the left you see the trends marked in color. The x-axis shows the end year of the trend period; the y-axis shows the start. The faint white lines at 45° show constant trend period, shown on the right axis.
On the right you see, in this case, the lower bound trends. That is the highest trend which allows you to say that the observed trend is significantly greater, at 95% confidence. It gives a cool side check to the trend. You can take a value, look up its color, and say that where you see that color or redder, you know the trend significantly exceeds that value.
Next I'll show the plot for all 5 indices used by Foster/Rahmstorf. This comes with the Javascript gadgetry I developed in previous posts. You can click on any point, and on the right you'll see printed the corresponding period and trends. On the corresponding time series plot, the red and blue balls will jump into position to show the trend. On that plot, there are controls that let you move the balls around to different locations. Below the graph, there are a set of radio button controls which allow you to switch the plot to any of the five datasets (giss,noaa,cru,rss,uah) used by Foster and Rahmstorf.
Now the lower bound plot. It shows that trend which is less than the observed trend, but is the highest of those for which the difference from the observed is significant. In most plots, for the longer periods, the color corresponds to about 1.3°C, so the observed (adjusted) trend is significantly higher than this.
Now the upper bound plot, converse of the above. It shows that trend which is greater than the observed trend, but is the least of those for which the difference from the observed is significant. In most plots, for the longer periods, the color corresponds to about 1.8°C, so the observed (adjusted) trend is significantly lower than this.
Sunday, December 18, 2011
Significant trend differences
In earlier posts I have shown plots of all possibly linear trends in about a century of surface temperature data from various sources. In this post I modified the plot by fading regions where the trend was not significantly different from zero.
But as commenter Frank noted, this is not the only significant difference that might be of interest. So in this post, I'll show some plots that help to bound the range of signficance.
The first plot shows, for each start and end month, the lowest trend that the observed trend would be significantly less than. That is useful for testing predictions that might be failing on the cool side. For example, if you think that there is a claim that the trend over a period should have been 2°C/century, you can see where the actual trend was significantly (at 95%) below that.
The second plot, below the jump, shows the converse. What is the highest trend that was significantly (95%) below the observed. This is probably mainly of interest in establishing whether a trend was significantly above zero, but you might be interested in other values - if you think a theory significantly under-predicts.
The final plot is of the t-statistic - the trend normalized by its standard error. This lets you look at other degrees of significance - mainly relative to zero, but in conjunction with the other plots, you can work out other trend comparisons too.
I've retained the apparatus whereby you can check each point (by clicking) against its plot, echoing the numerical trend value (and period). I've changed from earlier plots of this kind by allowing trend periods down to 1 year.
Saying that a trend is significantly different from a base trend is saying that the on the null hypothesis that the data is formed from the base trend plus random noise the observed result is improbable. Cautions:
bluer redder colors indicate regions where the trend observed was significantly less than the test (color). I have reversed the coloring custom of earlier posts, marking zero with dark brown, and 1.7°C/Century with gray. For the associated plot and mode of operation, see this post. But note that you can click anywhere on the plot to show the real trend there (shown in text and also by the time series plot).
And here is the second plot, showing trends where the observed would be significantly greater. The brown marks the edge of the area where the trend is significantly greater than zero.
And the third plot, which shows the t-statistic, or ratio of the trend to its standard error. For the number of degrees of freedom here, this is distributed normally, and 1.96, marked in brown, is the level of 95% significance. 1.64 is 90%, and 2.58 is 99%. One observation here is that there is only a small fringe region where a choice of a different test level would alter the result..
But as commenter Frank noted, this is not the only significant difference that might be of interest. So in this post, I'll show some plots that help to bound the range of signficance.
The first plot shows, for each start and end month, the lowest trend that the observed trend would be significantly less than. That is useful for testing predictions that might be failing on the cool side. For example, if you think that there is a claim that the trend over a period should have been 2°C/century, you can see where the actual trend was significantly (at 95%) below that.
The second plot, below the jump, shows the converse. What is the highest trend that was significantly (95%) below the observed. This is probably mainly of interest in establishing whether a trend was significantly above zero, but you might be interested in other values - if you think a theory significantly under-predicts.
The final plot is of the t-statistic - the trend normalized by its standard error. This lets you look at other degrees of significance - mainly relative to zero, but in conjunction with the other plots, you can work out other trend comparisons too.
I've retained the apparatus whereby you can check each point (by clicking) against its plot, echoing the numerical trend value (and period). I've changed from earlier plots of this kind by allowing trend periods down to 1 year.
Purpose
I should at this stage say that my purpose here is to show how the much invoked arithmetic of trend fitting works out. I'm not saying that it is always a good thing to do, and there are cautions about what significance means.Saying that a trend is significantly different from a base trend is saying that the on the null hypothesis that the data is formed from the base trend plus random noise the observed result is improbable. Cautions:
- Lack of significance does not mean the base trend is right. It just means it is consistent with this data. Many other possibilities would also be consistent.
- Significance does not mean that any physics, say AGW, is disproved. It just means that there may be something more than random variation plus trend.
- And it may not even mean that. It says the result, on the null hypothesis, is improbable. But improbable things happen. There are about half a million dots on the longest plots. If they were independent, and each had a 5% chance of being in a certain range, then that means 25000 significant dots. Even with correlation, you might still expect something like 5% of the area to show as significant.
Plots
So here is the first plot, showing which trends the observed trend would be significantly less than. To use it, pick a trend (color) you want to test from the legend. That andLand and Ocean Hadcrut GISSLO NOAA UAH MSU.RSS TempLS | Land Only BEST GissTs CRUTEM NOAAland Sea Surface HADSST2 |
And here is the second plot, showing trends where the observed would be significantly greater. The brown marks the edge of the area where the trend is significantly greater than zero.
Land and Ocean Hadcrut GISSLO NOAA UAH MSU.RSS TempLS | Land Only BEST GissTs CRUTEM NOAAland Sea Surface HADSST2 |
And the third plot, which shows the t-statistic, or ratio of the trend to its standard error. For the number of degrees of freedom here, this is distributed normally, and 1.96, marked in brown, is the level of 95% significance. 1.64 is 90%, and 2.58 is 99%. One observation here is that there is only a small fringe region where a choice of a different test level would alter the result..
Land and Ocean Hadcrut GISSLO NOAA UAH MSU.RSS TempLS | Land Only BEST GissTs CRUTEM NOAAland Sea Surface HADSST2 |
Friday, December 16, 2011
Google Map problem fixed
Well, I'm hoping. I posted a while ago a Google Maps rendition of the GHCN surface temperature network. The Javascript mechanics made it possible to select and display all kinds of subsets, and even show a movie.
I heard some reports that people were having trouble making it display. I'd been struggling a bit to make robust Javascript, but that was getting better. There's a complication that I have to have a valid GM ID, but that seemed OK - users shouldn't need one.
Today I found what I think was the problem. I've recently started using an Amazon bucket, and using a newly acquired Web address www.moyhu.org. But it seems that DNS servers don't always get to the right place using that. So I'm using the full Amazon address.
It seems to work now. It's here.
Thursday, December 8, 2011
Nov temps displayed with HTML 5
It's time for November temperatures with TempLS. The headline number is a cooling - from 0.48°C to 0.36°C. I'll show the usual comparative plot below.
But what I really want to talk about is a new style of presentation. The last few posts have tracked my learning curve with Javascript; now I'm coupling it with the canvas feature of HTML 5. This means I can do client-side graphics - much more flexible and interactive
What this means for November GHCN temperatures is that I can show the anomalies directly - without cell aggregation or smoothing with orthogonal functions. This is done by a triangular mesh and HTML5's neat linear color gradient function. Every station has it's anomaly directly represented with the correct color.
I found this very interesting, as it shows graphically how correlated the anomalies are. Most of the color picture is actually quite smooth. There are exceptions, and because these can be associated with large triangles, it gives an exaggerated effect there. But for the most part, large scale patterns show through well.
So here's the plot of November average temperature anomalies, in °C. It is of course interactive - you can rearrange it, magnify, show the stations, click to see station detail and numbers etc. Use Ctrl+. Ctrl- to get it the right size for your screen. The mechanics are explained below the jump.
Then you can click in the sphere. At the bottom on the right, the nearest station name and anomaly will appear. You may want to have stations displayed here. You'll see two faint numbers next to "stations". This indicates how much your clicked missed the station by (in pixels). It's not really a test of your mousing, but of my getting the alignment right (fiddly).
I'm continuing to work on the shading. The HTML5 function is good, but it works by RGB linear interpolation. The rainbow scheme that I use isn't linear (linear schemes are monochromatic and boring), so they get out of alignment. This sometimes means that one of the corners of the triangle does not get quite the right color. That can happen when there is a lot of change within a triangle.
and the Spherical Harmonics map
September
August
More data and plots
But what I really want to talk about is a new style of presentation. The last few posts have tracked my learning curve with Javascript; now I'm coupling it with the canvas feature of HTML 5. This means I can do client-side graphics - much more flexible and interactive
What this means for November GHCN temperatures is that I can show the anomalies directly - without cell aggregation or smoothing with orthogonal functions. This is done by a triangular mesh and HTML5's neat linear color gradient function. Every station has it's anomaly directly represented with the correct color.
I found this very interesting, as it shows graphically how correlated the anomalies are. Most of the color picture is actually quite smooth. There are exceptions, and because these can be associated with large triangles, it gives an exaggerated effect there. But for the most part, large scale patterns show through well.
So here's the plot of November average temperature anomalies, in °C. It is of course interactive - you can rearrange it, magnify, show the stations, click to see station detail and numbers etc. Use Ctrl+. Ctrl- to get it the right size for your screen. The mechanics are explained below the jump.
|
How it works
The flat map at top right is your navigator. If you click a point in that, the sphere will rotate so that point appears in the centre. The buttons below allow modification. Set what you want, and press refresh. You can show stations, and the mesh, and magnify 2×, 4×, or 8× (by setting both). You can click again to unset (and press refresh).Then you can click in the sphere. At the bottom on the right, the nearest station name and anomaly will appear. You may want to have stations displayed here. You'll see two faint numbers next to "stations". This indicates how much your clicked missed the station by (in pixels). It's not really a test of your mousing, but of my getting the alignment right (fiddly).
I'm continuing to work on the shading. The HTML5 function is good, but it works by RGB linear interpolation. The rainbow scheme that I use isn't linear (linear schemes are monochromatic and boring), so they get out of alignment. This sometimes means that one of the corners of the triangle does not get quite the right color. That can happen when there is a lot of change within a triangle.
Comparative plot of recent months, and the usual spherical harmonics fit.
and the Spherical Harmonics map
Previous Months
OctoberSeptember
August
More data and plots
Subscribe to:
Posts (Atom)