Tuesday, September 18, 2018

GISS August global down 0.01°C from July.

The GISS land/ocean temperature anomaly fell 0.01°C last month. The August anomaly average was 0.77°C, down from July 0.78°C. For the second month, the GISS report is not listed at the news page. It seems to be the fifth warmest August in the record, or, to put it another way, the coolest since 2013 (but warmer than any August before that). In some contrast TempLS rose 0.03°, but the changes are small. Satellite indices both fell considerably. In the last two months, satellite TLT rose and fell by about the same amount, while changes at surface were small.

Update I see that James Hansen and Makiko Sato have been issuing regular monthly reports as the GISS numbers are posted. The current one is here. There is a list of past reports here, where you can ask to get them by email.

The overall pattern was similar to that in TempLS. Very warm in Europe, extending to Siberia and NE Africa. .Also warm in N America, West coast and acean and NE. Cool spots in S Brazil and S Africa.

As usual here, I will compare the GISS and previous TempLS plots below the jump.

Saturday, September 8, 2018

August global surface TempLS up 0.032 °C from July.

The TempLS mesh anomaly (1961-90 base) rose a little, from 0.641°C in July to 0.673°C in August. This is opposite to the 0.067°C fall in the NCEP/NCAR index, while the UAH satellite TLT index declined more (0.13°C). There may be a reason for that discrepancy, which happened in the opposite direction last month. Although the land temperatures went down a little, SST went up, by about 0.04°C, which is quite a big month change for SST. It makes it warmest since last November, and could be the first sign of a coming El Niño influence. The reanalysis and troposphere measures do not use SST directly.

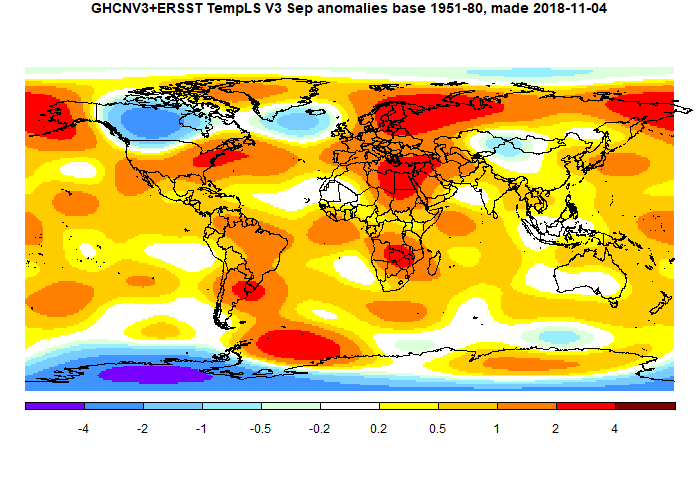
As with the reanalysis, there were few prominent patterns in the month. Cool in parts of S America, N Canada, and a large region of A Australia and adjacent ocean. Still warm in E Europe and far N Siberia, and NE USA. Antarctica was the only notably warm place (relatively).
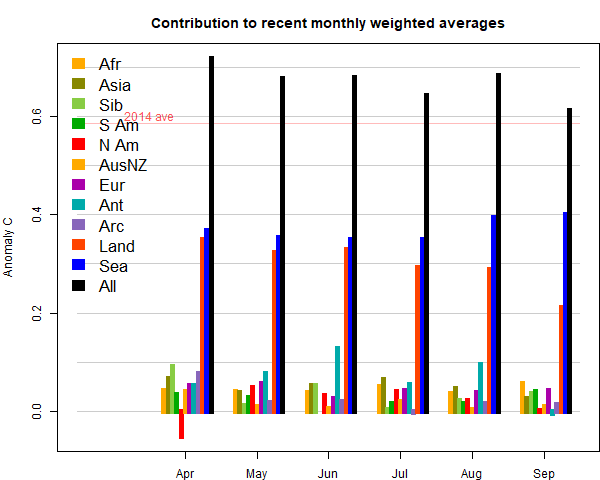
 Here (from here) is the plot of relative contributions to the rise (ie components weighted by area). Note, as mentioned above, the strong effect of the SST rise on the global average:

Here is the temperature map. As always, there is a more detailed active sphere map here.


Monday, September 3, 2018

August NCEP/NCAR global surface anomaly down by 0.067°C from July

In the Moyhu NCEP/NCAR index, the monthly reanalysis anomaly average fell from 0.261°C in July to 0.194°C in August, 2018. This is a slightly greater drop than the previous month's rise, and so makes August the coldest month since July 2015 in this surface re cord. In the lower troposphere, UAH also fell by a little more, 0.13°C, than the previous month's rise.

There were few prominent patterns in the month. Cold in parts of S America, N Canada, and a large region of W Australia and adjacent ocean. Still warm in E Europe and far N Siberia, and NE USA. Contrasts in Antarctica.

BoM is still on El Niño Watch, meaning about a 50% chance, they say, but not yet happening.

Arctic Ice seems to have thawed slowly lately, with a likely September minimum about average for recent years.