Wednesday, January 27, 2016

The fleeting pause

At WUWT, there is a monthly post (latest here recording the duration of the Pause, which Lord Monckton defines as the maximum time back that a satellite index, RSS, can be found to have trend less than zero. The choice of that index, which measures an average of troposphere temperature by a complex analysis of data from several satellites, is necessary because all of the better known surface temperature indices have rising trends for all recent periods.

So there is lots of cherry picking. You can see what is actually going on in this calculation in the following back trend graph (from this active plotter).


The graph shows, for various indices, the trend from the year on the x axis to present (Dec 2015). You can see the cherry picking in the choice of index. RSS is the lowest green curve. It now has UAH V6 beta for company, but only recently; V5.6, still being published, was up with the surface indices. The Pause starts from the first crossing of the x-axis, which I've marked with a red circle. But you'll see that even so, most of the curve is positive. The excursions below the axis are brief and shallow, and about to come to an end. In fact the shape is not too far from an inverted image of the time series itself. The big temperature peak in 1998 shows as a dip, while the following trough shows as a local peak in trend. That is why the "pause" has persisted - because of the very big 1998 peak which depresses subsequent trends.

I'll show later how the troposphere measures respond strongly but late to an El Nino. So much higher readings are expected in the coming months. But already those curves are rising rapidly, and I expect them to clear the axis within two or three months. In fact, I'll show a fairly easy way of measuring this, in terms of temperatures to come. Specifically:
  • If the January anomaly exceeds about 1.3°C, the Pause is gone. This is unlikely.
  • If the Jan and Feb anomalies exceed on average about 0.77°C, the curve will be above the axis. For reference, the Dec anomaly was 0.543°C. I think this is quite likely.
  • If the first three months exceed 0.59°C on average, that would suffice to extinguish the pause. That is barely above the December value, and I think very likely indeed.
  • If Jan-April exceed 0.5°C, that will also suffice.
I'll explain the arithmetic below the fold.

Saturday, January 23, 2016

History of record warm years.

Last year, I posted plots of the progress of the record warmest year for various datasets. This year, I'll show an update for the three main surface sets. The jump from 2014 to 2015 is among the largest record jumps in at least a century. Here is GISS:


And below the fold, NOAA and HADCRUT:

Thursday, January 21, 2016

GISS and TempLS compared, in December and in 2015.

In my previous post, I noted the record levels reached in both the NOAA and GISS indices in December, and for 2015. In the NOAA report they note that December 2015 exceeded any earlier December by 0.29°C.

In this post, I'll present my usual map comparison between GISS and TempLS mesh in December. But I'll also expand on the continued close association between GISS and TempLS mesh, on one hand, and NOAA and TempLS grid on the other. The plot below shows those timeseries for 2015:


There is a deviation in the first three months, where both GISS and NOAA drifted away. I wonder if it is a concidence that these were the last months before introduction of ERSST4. But otherwise, the pairing, and close tracking of the pairs is very evident.

GISS up by 0.07°C in December, NOAA by 0.14, many records set.

As widely discussed here, 2015 was record hot, and getting hotter at the end. NOAA and GISS made a joint release - NOAA's report is here. For 2015 the annual average anomaly for 2015 was 0.9 °C, which beat the 2014 record level by 0.16°C. GISS put it at 0.87°C, relative to their 1951-80 base; for 2014 it was 0.74.

For December, GISS reported 1.12°C. This was a rise of 0.07°C from November. As usual, this was very close to the change in TempLS mesh, which now stands at 0.076°C. The rise in NOAA (0.14) was also, as usual, very similar to TempLS grid (0.16°C).

According to the NCEP/NCAR index, January is even hotter again, by a long way. The last two days have been cooler. I'll post more on the historical significance of these huge monthly and annual readings shortly, along with the usual GISS/TempLS comparison.


Sunday, January 17, 2016

An old WUWT SST blooper back to life.

In recent days, someone who comments as Kristian, but blogs as okulaer, has been active. He commented here to draw attention to his extensive recent posts, and has been plastering the material at WUWT. The ratio of sense to graphs is small. But there is one I want to treat here, since it relates to a 2010/2 blooper by Bob Tisdale at WUWT, and on his own blog .

Kristian posted a WUWT comment here, saying that GISS land mask had failed, and showing (from here) this plot:


It shows trends (despite y-axis label) of land-masked GISS vs OIv2 SST, which GISS used at the time. The divergence near the poles is attributed to GISS "deleting data". Now I should say that this plot does not seem to have been cross-posted at WUWT. But it expresses Bob's complaint at WUWT about deleting data, and is referred to most months at WUWT (see pingback list) in Bob's updates, most recently Nov 2015 here. The boiler-plate complaint is
Unlike the UK Met Office and NCEI products, GISS masks sea surface temperature data at the poles, anywhere seasonal sea ice has existed, and they extend land surface temperature data out over the oceans in those locations, regardless of whether or not sea surface temperature observations for the polar oceans are available that month. Refer to the discussions here and here.

Sunday, January 10, 2016

Satellite temperature readings diverge from surface, and each other.

The satellite indices from UAH and RSS try to measure temperature in the lower troposphere by a very complicated process of deduction from microwaves emitted by oxygen. Recently, they indicate temperatures that are rising more slowly than surface measures. So they are popular with naysayers, who gloss over the fact that they are actually measuring (or attempting to measure) very different things.

A prominent recent example was Ryan O'Hare, in the Daily Mail, headline:
"2015 may NOT have been the hottest year on record after all: Satellite data shows temperatures were lower than first thought"

Totally inaccurate, of course. Satellite temperatures do not contradict the surface record. They say (less reliably) something about the temperature in a different place. But this seems to be being worked up as the standard distraction from the 2015 record temperature. For last year's record, they tried Oh, but we can't be sure. This time the margin will be too great for that, so satellites will have to do.

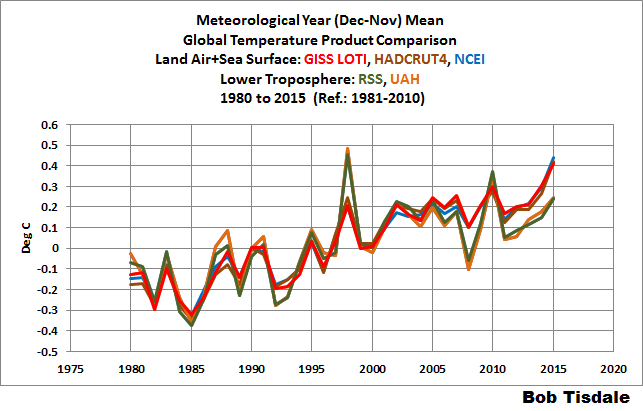
There is a WUWT post here which tries by comparison to suggest that surface temperatures are trending differently to troposphere, and are therefore wrong. It's one of many, and graphs like this crop up:


I drew attention here to the huge adjustment that was made to UAH this year, in going from V5.6 to V6. In fact, the V6 plotted above is still in beta, and V5.6 is still maintained. So recently I restored it to the datasets that I collect and plot, and you can see it in the active plot. So I thought I would add V5.6 to this comparison. And sure enough, V5.6 is far closer to the surface measures than it is to V6 (or RSS). Below the fold is a snapshot, where the anomaly base is 1981-2010 for all:

Thursday, January 7, 2016

Big rise in TempLS in Dec; record-breaking 2015 was 0.129°C hotter than 2014.

The TempLS mesh global anomaly (1961-90) rose by 0.07°C in December (from 0.894 to 0.964). That makes it the hottest month in the record, beating October by 0.04°C. And it makes 2015 by far the hottest year. The annual average was 0.727°C, exceeding that of 2014 (the previous max) by 0.129. This is based on 4200 stations reporting in December; Greenland and Mexico have not yet reported.

The rise was a little less than that for the Moyhu NCEP/NCAR index, which rose by 0.108°C from Nov to Dec. However, TempLS grid rose even more, by 0.164°C (from .832 to .996). And the annual mean, at 0.744°C) exceeded the previous record by 0.163°C.

In terms of implication for the major indices, as usual LS mesh links with GISS and grid with NOAA and HADCRUT. That would make a figure of at least 1.1°C for GISS - my guess would be about 1.15, and bigger rises in NOAA and HADCRUT. Of course all will have 2015 as a record year. GISS at 1.15 for December would put the annual average at 0.870°C, 0.127°C higher than 2014 (the previous record).

The breakdown for December showed a small drop in SST contribution, outweighed by rises in Asia, Siberia, and N America. The map shows a huge band of warmth around the 50°N parallel, through Eastern N America, Eurppe and Russia. Then also the El Nino region. Antarctica and Arctic were more normal, which is cooler than recent months. Changes in these regions are more strongly reflected in TempLS mesh than grid, which probably explains the greater rise in LS grid.

The satellite measures also showed strong rises - RSS from 0.428°C to 0.543°C in Dec. As Sou noted, that means that each of the last three months was the hottest ever (of that month) in the troposphere record.

I'll put the full report below the fold.

Tuesday, January 5, 2016

Checking the Moyhu NCEP/NCAR index.

For over a year, I have been integrating the NCEP/NCAR gridded daily reanalysis, and posting the time series here, together with monthly anomaly averages. A commenter at Tamino's recently noted that you could access global monthly average temperatures at NOAA ESRL PSD. You can either make the table from tools at this page, or just use this URL. It isn't exactly the same data - I use sig995, which this tool doesn't include, but it does offer surface temperature.

So with the ESRL data, I subtract the mean of the respective months of 1994-2013 from the overall monthly totals, and compare with the monthly averages I post. Here is a table of discrepancies for 2015, in the monthly anomalies, in °C
Jan-Mar Apr-Jun Jul-Sep Oct-Dec
-0.00010.0006-0.00060.0008
0.0032-0.0004-0.00060.0004
0.0003-0.0001-0.00170.0003

Mostly it is accurate to 3 sig figs. The exception is February, which also stands out in 2014. I think the reason is the treatment of leap years. With ESRL I subtracted the means of all Februaries in the base from the monthly means, while in my posting method, I form anomalies for each date first, abd then average to get the month. So in effect, for 2015 I compare with the average of all periods Feb1-28. Both ways are reasonable, and the difference is small.

AFAIK, there is no published global average of daily anomalies, so I will keep doing it the way I do. But it is useful to have the check of the monthly averages, and also to know that there is such little difference between surface and sig995.

I'm currently dealing with change of year issues - I'm restructuring the whole posting calculation to make it less year-dependent. Numbers for 2016 should appear soon.


Sunday, January 3, 2016

NCEP/NCAR December, up by 0.108°C - highest anomaly in record (again).

The Moyhu NCEP/NCAR index for December was 0.621°C, up from November's 0.513°C, and ahead of the previous record - October 2015 at 0.567°C, which itself was a big jump on the previous record. It was an eventful month, with another extraordinary peak early, then mid-month the steepest plunge in recent years (but only to values which would have been high a few months ago) and then back to hot at the end.

There were some late data troubles - a data pause from NCEP for three days, and at my end, I have some end of year issues to fix. But they don't affect the results posted.

Adjusted to the 1951-1980 baseline of GISS, that would give a month anomaly of 1.18°C. The current record there is October at 1.06°C. I would expect that GISS might be a bit lower than 1.18, but still the hottest month in the record. Which makes 2015 even more securely the hottest year.