So there is lots of cherry picking. You can see what is actually going on in this calculation in the following back trend graph (from this active plotter).

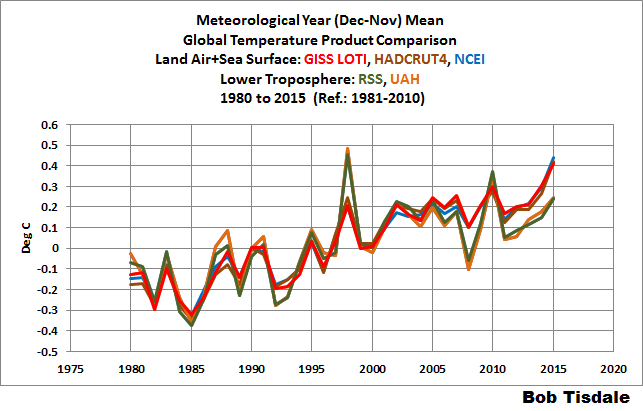
The graph shows, for various indices, the trend from the year on the x axis to present (Dec 2015). You can see the cherry picking in the choice of index. RSS is the lowest green curve. It now has UAH V6 beta for company, but only recently; V5.6, still being published, was up with the surface indices. The Pause starts from the first crossing of the x-axis, which I've marked with a red circle. But you'll see that even so, most of the curve is positive. The excursions below the axis are brief and shallow, and about to come to an end. In fact the shape is not too far from an inverted image of the time series itself. The big temperature peak in 1998 shows as a dip, while the following trough shows as a local peak in trend. That is why the "pause" has persisted - because of the very big 1998 peak which depresses subsequent trends.
I'll show later how the troposphere measures respond strongly but late to an El Nino. So much higher readings are expected in the coming months. But already those curves are rising rapidly, and I expect them to clear the axis within two or three months. In fact, I'll show a fairly easy way of measuring this, in terms of temperatures to come. Specifically:
- If the January anomaly exceeds about 1.3°C, the Pause is gone. This is unlikely.
- If the Jan and Feb anomalies exceed on average about 0.77°C, the curve will be above the axis. For reference, the Dec anomaly was 0.543°C. I think this is quite likely.
- If the first three months exceed 0.59°C on average, that would suffice to extinguish the pause. That is barely above the December value, and I think very likely indeed.
- If Jan-April exceed 0.5°C, that will also suffice.


