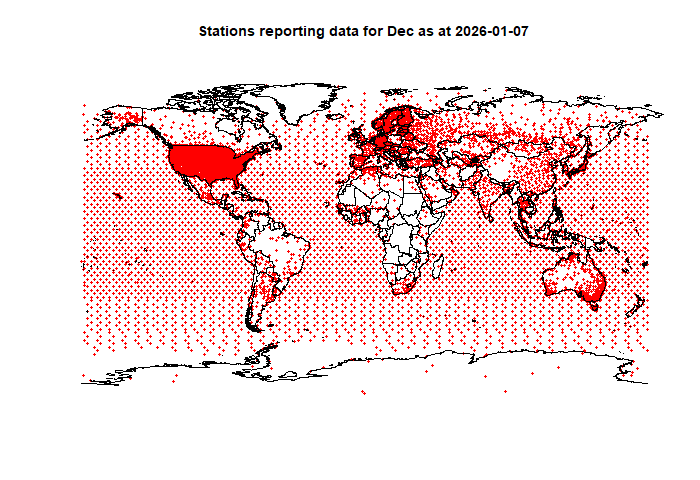
There was an apparent turnaround with GHCN this month. Since July 2025, it has taken many days to get more than about 2500 stations outside US (the resolution-limiting number), and then omitted countries like China and Iran. So I had to supplement with data from JMA, which also took about 10 days to appear. But now, on the 4th of the month, we have 4263 such stations, which is more than the best of times in the past. I'm cautious about it - sometimes the number goes down. Anyway, here is the map of stations, including China and Iran:
Here is the corresponding stacked graph, note the annual values:
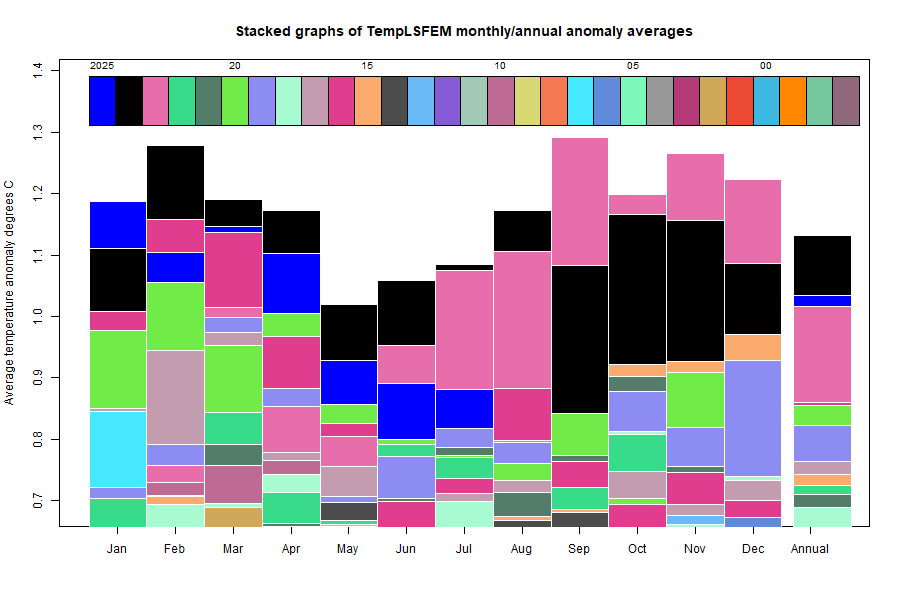
Being so close to 2023, 2025 is barely visible. Below is the temperature map for December, using the FEM-based map of anomalies. Use the arrows to see different 2D Earth projections.
As always, the 3D globe map gives better detail. There are more graphs and a station map in the ongoing report which is updated daily.