Tuesday, December 17, 2019

GISS November global steady from October at 1.02°C.

The GISS V4 land/ocean temperature anomaly stayed at 1.02°C in November, same as October. It compared with a 0.063deg;C fall in TempLS V4 mesh (latest figures). GISS also had 2019 as second-warmest November after 2015.

Updating of GHCN V4 this month is fitful, so this figure may change. I see that BEST has delayed publishing November's result.

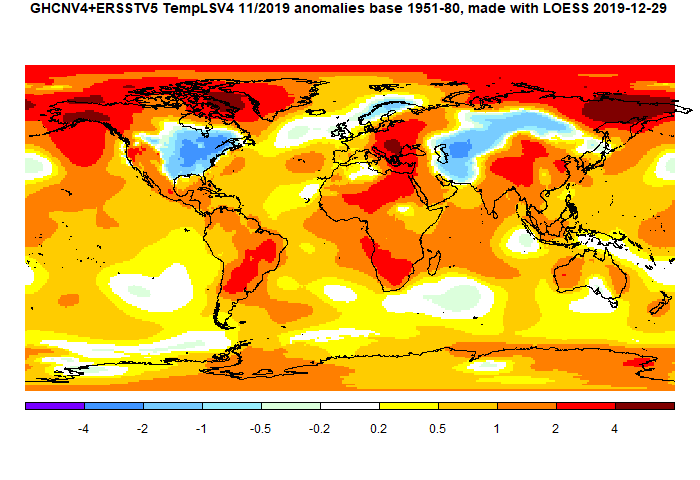
The overall pattern was similar to that in TempLS. Cool band through Central Asia into Siberia. Warm just about everywhere else, especially Arctic.

As usual here, I will compare the GISS and earlier TempLS plots below the jump.

Saturday, December 14, 2019

November global surface TempLS down 0.063°C from October.

The TempLS mesh anomaly (1961-90 base) was 0.824deg;C in November vs 0.887°C in October. This was similar to the 0.067°C fall in the NCEP/NCAR reanalysis base index. This makes it the second warmest November in the record, after the El Niño 2015. So it almost certain that 2019 will be the second warmest year after 2016 (currently averaging 0.811°C vs 0.855 for 2016). However, so far December has been exceptionally warm, which could bring 2019 even closer.

As I posted yesterday, GHCN data was delayed this month. The file dates posted remained at 6 Dec until just recently, when one dated 12 Dec appeared. It still seems a little lightweight for the date, but it gives me more than my target minimum of 12000 total stations or posting. Actually FWIW waiting didn't make much difference; the earlier file gave an average of 0.828°C.

The pattern echoed features of the recent months. Once again a cold spot in N America, this time east of the Rockies, and also a hot spot over Alaska/NW. This extends to very warm in NE Siberia and the Canadian Arctic islands. Warm in Arctic generally, and a band from E Europe right down through Africa, A cold band in central Asia.

Here is the temperature map, using the LOESS-based map of anomalies.


As always, the 3D globe map gives better detail.


Friday, December 13, 2019

November global surface temperatures delayed.

The usual TempLS calculation of global temperature is awaiting new posting of GHCN V4 surface land data from NOAA. The last update was on 7 December, although even that seemed to be the same as the day before.

The data is currently missing China, Kazakhstan and Mexico. FWIW it shows a drop from October of about 0.06°C. I'll post as soon as new data appears. I usually wait until we have 12000 or more stations (including SST) - currently 10284.


Tuesday, December 3, 2019

November global surface reanalysis down 0.067°C from October.

The Moyhu NCEP/NCAR index fell from 0.475°C in October to 0.408°C in November, on a 1994-2013 anomaly base. That brings it back to about the level of the previous month, but continues the relatively stable warm period since May.

Most of North America was cool, except toward Alaska. far W Europe and most of Russia/Iran also cool. Central Europe was warm, elsewhere mixed. NE Pacific and Greenland were warm.