As I posted yesterday, GHCN data was delayed this month. The file dates posted remained at 6 Dec until just recently, when one dated 12 Dec appeared. It still seems a little lightweight for the date, but it gives me more than my target minimum of 12000 total stations or posting. Actually FWIW waiting didn't make much difference; the earlier file gave an average of 0.828°C.
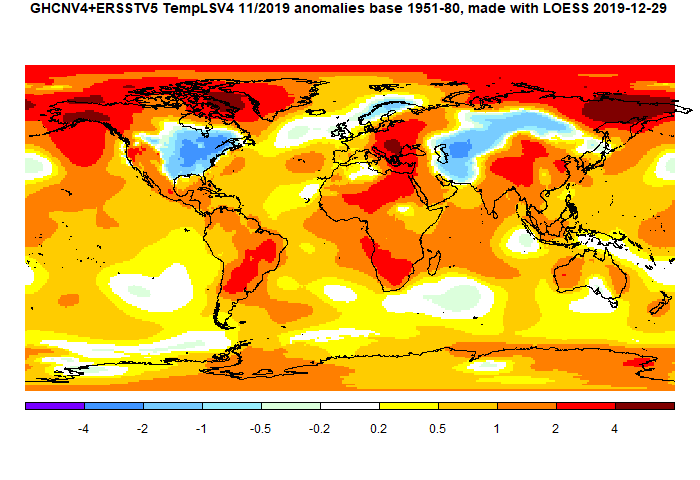
The pattern echoed features of the recent months. Once again a cold spot in N America, this time east of the Rockies, and also a hot spot over Alaska/NW. This extends to very warm in NE Siberia and the Canadian Arctic islands. Warm in Arctic generally, and a band from E Europe right down through Africa, A cold band in central Asia.
Here is the temperature map, using the LOESS-based map of anomalies.
 As always, the 3D globe map gives better detail.
This post is part of a series that has now run since 2011. The TempLS mesh data is reported here, and the recent history of monthly readings is here. Unadjusted GHCN is normally used, but if you click the TempLS button there, it will show data with adjusted, and also with different integration methods. There is an interactive graph using 1981-2010 base period here which you can use to show different periods, or compare with other indices. There is a general guide to TempLS here.
The reporting cycle starts with a report of the daily reanalysis index on about the 4th of the month. The next post is this, the TempLS report, usually about the 8th. Then when the GISS result comes out, usually about the 15th, I discuss it and compare with TempLS. The TempLS graph uses a spherical harmonics to the TempLS mesh residuals; the residuals are displayed more directly using a triangular grid in a better resolved WebGL plot here.
A list of earlier monthly reports of each series in date order is here:


0 comments:
Post a Comment