The GISS land/ocean temperature anomaly rose 0.01°C last month. The July anomaly average was 0.78°C, up from June 0.77°C. The GISS report does not seem to be posted yet, or at least is not linked from their news page, but the gist is at Axios. It notes that it is the third warmest July in the record. The small rise contrasts with the downward TempLS, but the NCEP/NCAR index rose a little more. Satellite indices both rose considerably. The disagreement between GISS and TempLS is the opposite of last month, so little difference over two months.
The overall pattern was similar to that in TempLS. Very warm in Europe, extending to W Siberia and N Africa. .Also warm in N America, West coast and NE. Rather cold in Argentina and Arctic.
As usual here, I will compare the GISS and previous TempLS plots below the jump.
Friday, August 17, 2018
Tuesday, August 14, 2018
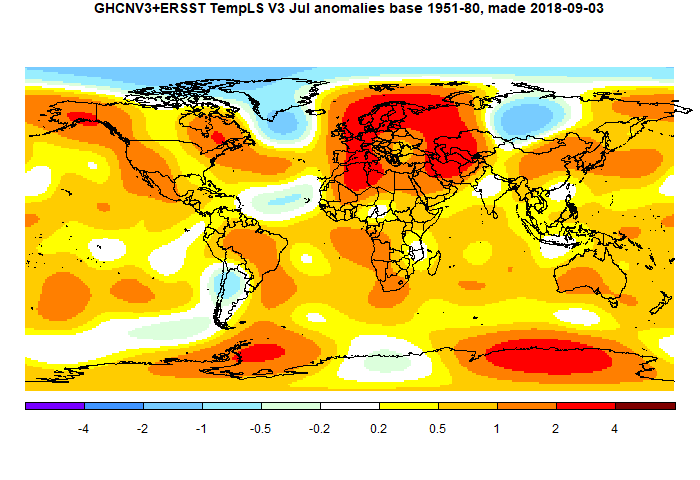
July global surface TempLS down 0.045 °C from June.
The TempLS mesh anomaly (1961-90 base) fell a little, from 0.680°C in June to 0.635°C in July. This is opposite to the 0.052°C rise in the NCEP/NCAR index, while the UAH satellite TLT index rose more (0.11°C).
The post is late again this month, and for the same odd reason. Australia submitted a CLIMAT form with about 1/3 the right number of stations, mostly SE coast. Kazakhstan, Peru were late too, but Australia is the big one. That data still isn't in. I've modified the map in the TempLS report to show the stations that reported last month (but not this) in a pale blue to show what is missing.
There were some noted heat waves, but relatively restricted in space and time. There was a big blob of heat covering Europe, N Africa and up to W Siberia. Mid Siberia was cold, as was Greenland and nearby sea, and Argentina. Arctic was cool, Antarctic warmer. N America was warm, especially W Coast and Quebec. SSTs continued rising overall.
Here is the temperature map. As always, there is a more detailed active sphere map here.
Friday, August 3, 2018
July NCEP/NCAR global surface anomaly up by 0.052°C from June
In the Moyhu NCEP/NCAR index, the monthly reanalysis anomaly average rose from 0.209°C in June to 0.261°C in July, 2018. June was cold by recent standards, so that is a modest recovery. In the lower troposphere, UAH rose more, by 0.11°C.
Notably, there were heat waves in W and N Europe, extending in a band through Russia, and into N Sahara. Parts of W and E North America were also hot, but unevenly so. Cool areas in S America and Southern Africa, and Central Siberia. The Arctic was mixed, with some cold, and the Antarctic even more so.
BoM is on El Niño Watch, meaning about a 50% chance, they say, but nothing yet.
Arctic Ice seems to have thawed rapidly lately, but there may be recent artefacts. JAXA has been irregular.
Subscribe to:
Posts (Atom)


