The GISS V4 land/ocean temperature anomaly was 0.80°C in May 2021, up from 0.76°C in April. This small rise is similar to the 0.012°C increase reported for TempLS. Jim Hansen's report is here.
As usual here, I will compare the GISS and earlier TempLS plots below the jump.
Tuesday, June 15, 2021
Sunday, June 6, 2021
May global surface TempLS up 0.012°C from April.
The TempLS mesh anomaly (1961-90 base) was 0.67°C in May, up from 0.658°C in April. It was cool relative to recent Mays, although 2018 and 2015 were a little cooler.. The NCEP/NCAR reanalysis base index rose more - 0.089°C. However, it did not rise much in April, when TempLS did.
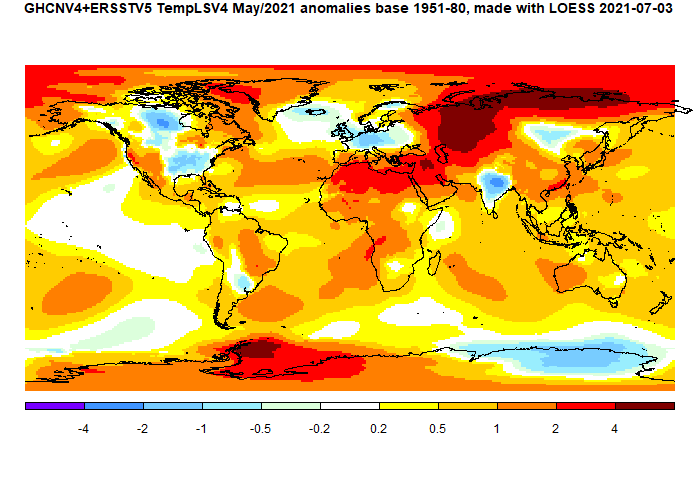
Cold patches in W Europe and Eastern US have been talked about. Also cold in India and N Canada. But it was warm in central Russia and much of the Arctic. Also in N Africa and the Middle East.
Here is the temperature map, using the LOESS-based map of anomalies.
Cold patches in W Europe and Eastern US have been talked about. Also cold in India and N Canada. But it was warm in central Russia and much of the Arctic. Also in N Africa and the Middle East.
Here is the temperature map, using the LOESS-based map of anomalies.
Subscribe to:
Posts (Atom)