The GISS V4 land/ocean temperature anomaly was 0.9°C in February 2022, down from 0.91°C in January. This small drop is very similar to the 0.017°C decrease (now 0.022°C) reported for TempLS.
As usual here, I will compare the GISS and earlier TempLS plots below the jump.
Tuesday, March 15, 2022
Tuesday, March 8, 2022
February global surface TempLS down 0.017°C from January.
The TempLS mesh anomaly (1961-90 base) was 0.704°C in February, down from 0.721°C in January. That makes it the seventh warmest February in the record. The NCEP/NCAR reanalysis base index fell by 0.025°C.
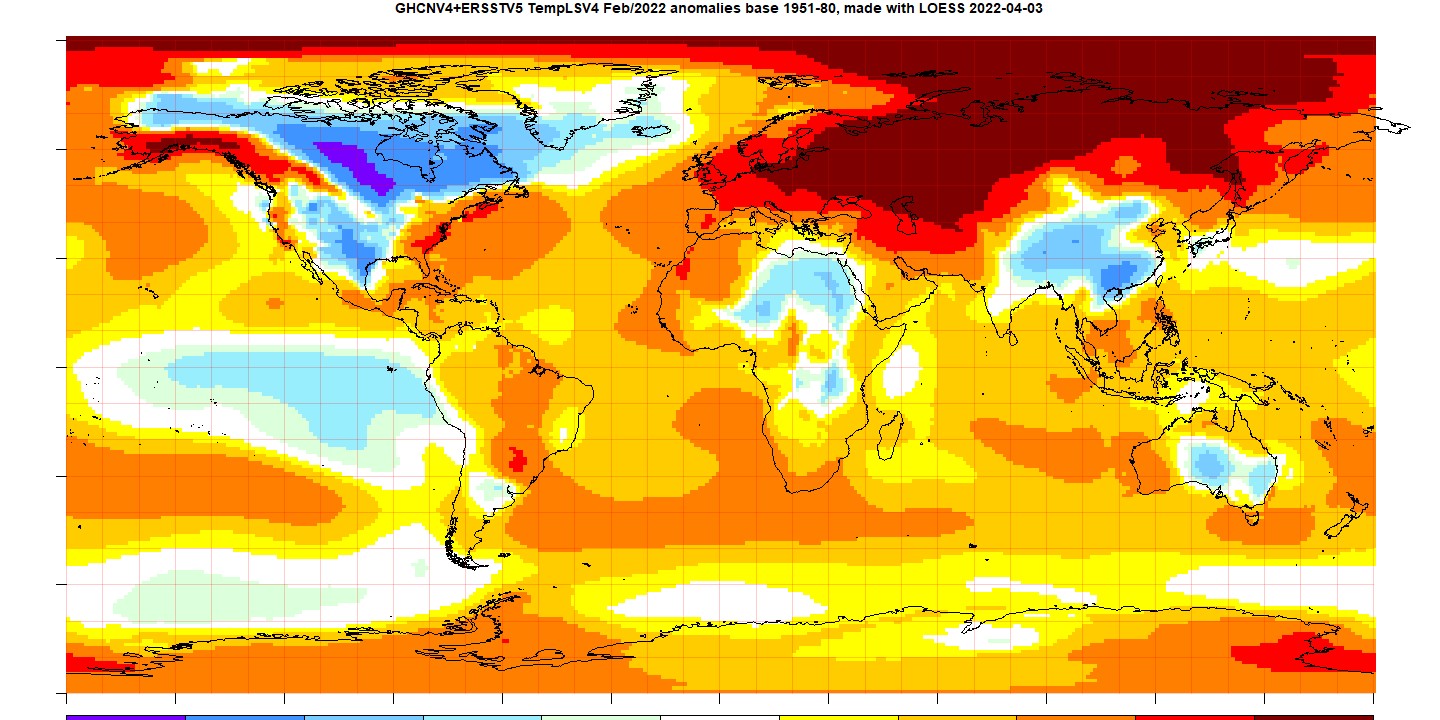
The most prominent feature is the cold in N America and China, and the warmth almost everywhere else in Eurasia. The Eastern Sahara and Australia were also cool.
Here is the temperature map, using the LOESS-based map of anomalies.

As always, the 3D globe map gives better detail. There are more graphs and a station map in the ongoing report which is updated daily
The most prominent feature is the cold in N America and China, and the warmth almost everywhere else in Eurasia. The Eastern Sahara and Australia were also cool.
Here is the temperature map, using the LOESS-based map of anomalies.

As always, the 3D globe map gives better detail. There are more graphs and a station map in the ongoing report which is updated daily
Subscribe to:
Comments (Atom)


