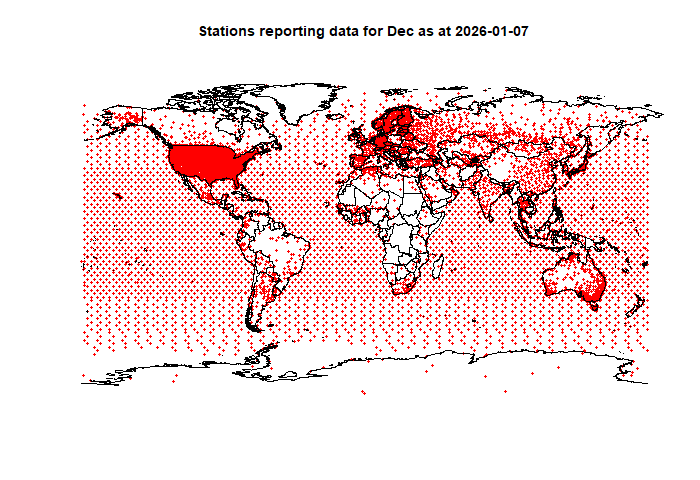
There was an apparent turnaround with GHCN this month. Since July 2025, it has taken many days to get more than about 2500 stations outside US (the resolution-limiting number), and then omitted countries like China and Iran. So I had to supplement with data from JMA, which also took about 10 days to appear. But now, on the 4th of the month, we have 4263 such stations, which is more than the best of times in the past. I'm cautious about it - sometimes the number goes down. Anyway, here is the map of stations, including China and Iran:
Here is the corresponding stacked graph, note the annual values:
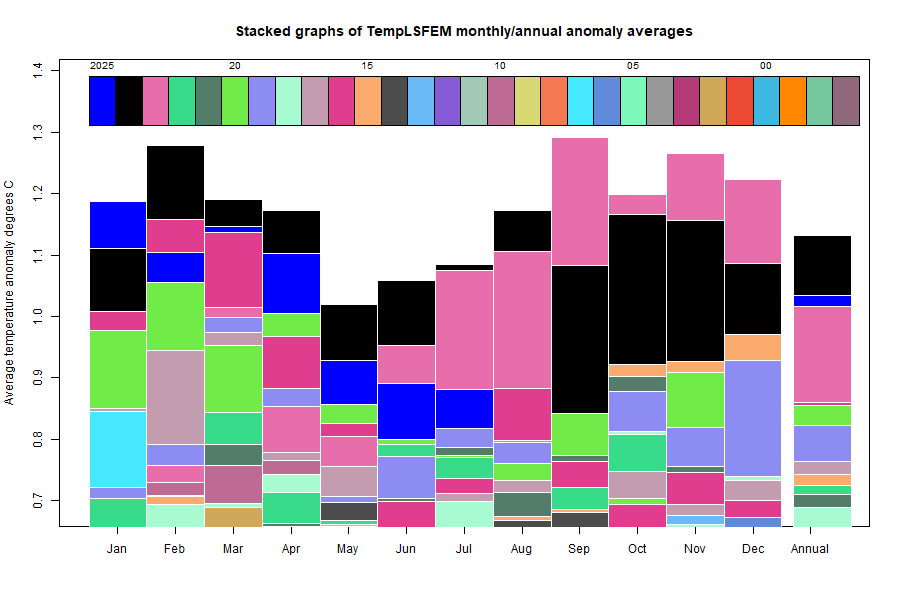
Being so close to 2023, 2025 is barely visible. Below is the temperature map for December, using the FEM-based map of anomalies. Use the arrows to see different 2D Earth projections.
As always, the 3D globe map gives better detail. There are more graphs and a station map in the ongoing report which is updated daily.
This post is part of a series that has now run since 2011. The TempLS mesh data is reported here, and the recent history of monthly readings is here. Unadjusted GHCN is normally used, but if you click the TempLS button there, it will show data with adjusted, and also with different integration methods. There is an interactive graph using 1981-2010 base period here which you can use to show different periods, or compare with other indices. There is a general guide to TempLS here.
The reporting cycle starts with the TempLS report, usually about the 8th of the month. Then when the GISS result comes out, usually about the 15th, I discuss it and compare with TempLS. The TempLS graph uses the FEM solution on a regular near equal area grid on the sphere ; the residuals are displayed more directly using a triangular grid in a WebGL plot here.
A list of earlier monthly reports of each series in date order is here:


Just wanted to share that I've started a substack that might be of interest to your readers: https://open.substack.com/pub/thesaraphreport/p/an-endangerment-finding-story?r=ywmw&utm_campaign=post&utm_medium=web
ReplyDeleteThanks, Marcus. This link may work directly.
Deletehttps://open.substack.com/pub/thesaraphreport/p/an-endangerment-finding-story?utm_campaign=post-expanded-share&utm_medium=post%20viewer
ReplyDeleteHi Nick,
ReplyDeleteI hope you’re doing well and staying healthy. I just wanted to ask if you have an idea of when the February GHCN report might be posted. Please don’t feel any rush on my account—take whatever time you need. I’m really enjoying the website, as always.
Sorry about slowness. Early in the month GHCN data was unusually bad, but a lot has arrived recently. I have been rather busy, but will write it tomorrow. Most of the info is in the report on this page.
DeleteSorry, I mean this page
Deletehttp://www.moyhu.blogspot.com.au/p/latest-ice-and-temperature-data.html