Saturday, October 19, 2024

September global surface TempLS down 0.071°C from August.

The TempLS FEM anomaly (1961-90 base) was 1.094°C in September, down from 1.165°C in August. It was a record in a way - it is the first month of the last 16 that was not a record warm. September 2023 was 1.21°C; however last month was warmer than any September before 2023.

This month's posting has been delayed by the late posting of results from NOAA, which was affected by the floods in Asheville.

Here is the corresponding stacked graph, showing how much hotter recent months have been:


Here is the temperature map, using the FEM-based map of anomalies. Use the arrows to see different 2D projections.


As always, the 3D globe map gives better detail. There are more graphs and a station map in the ongoing report which is updated daily.

Friday, October 11, 2024

When regression doesn't work - Florida hurricanes

Firstly an apology - no TempLS yet for September. The reason is floods in Asheville, where the NOAA GHCN data comes from (in better times).

I'm writing about a post by Roy Spencer on the statistics of major hurricanes landfalling in Florida. His data comes from this Wiki table. He does a plot of intensity of major hurricanes against time:


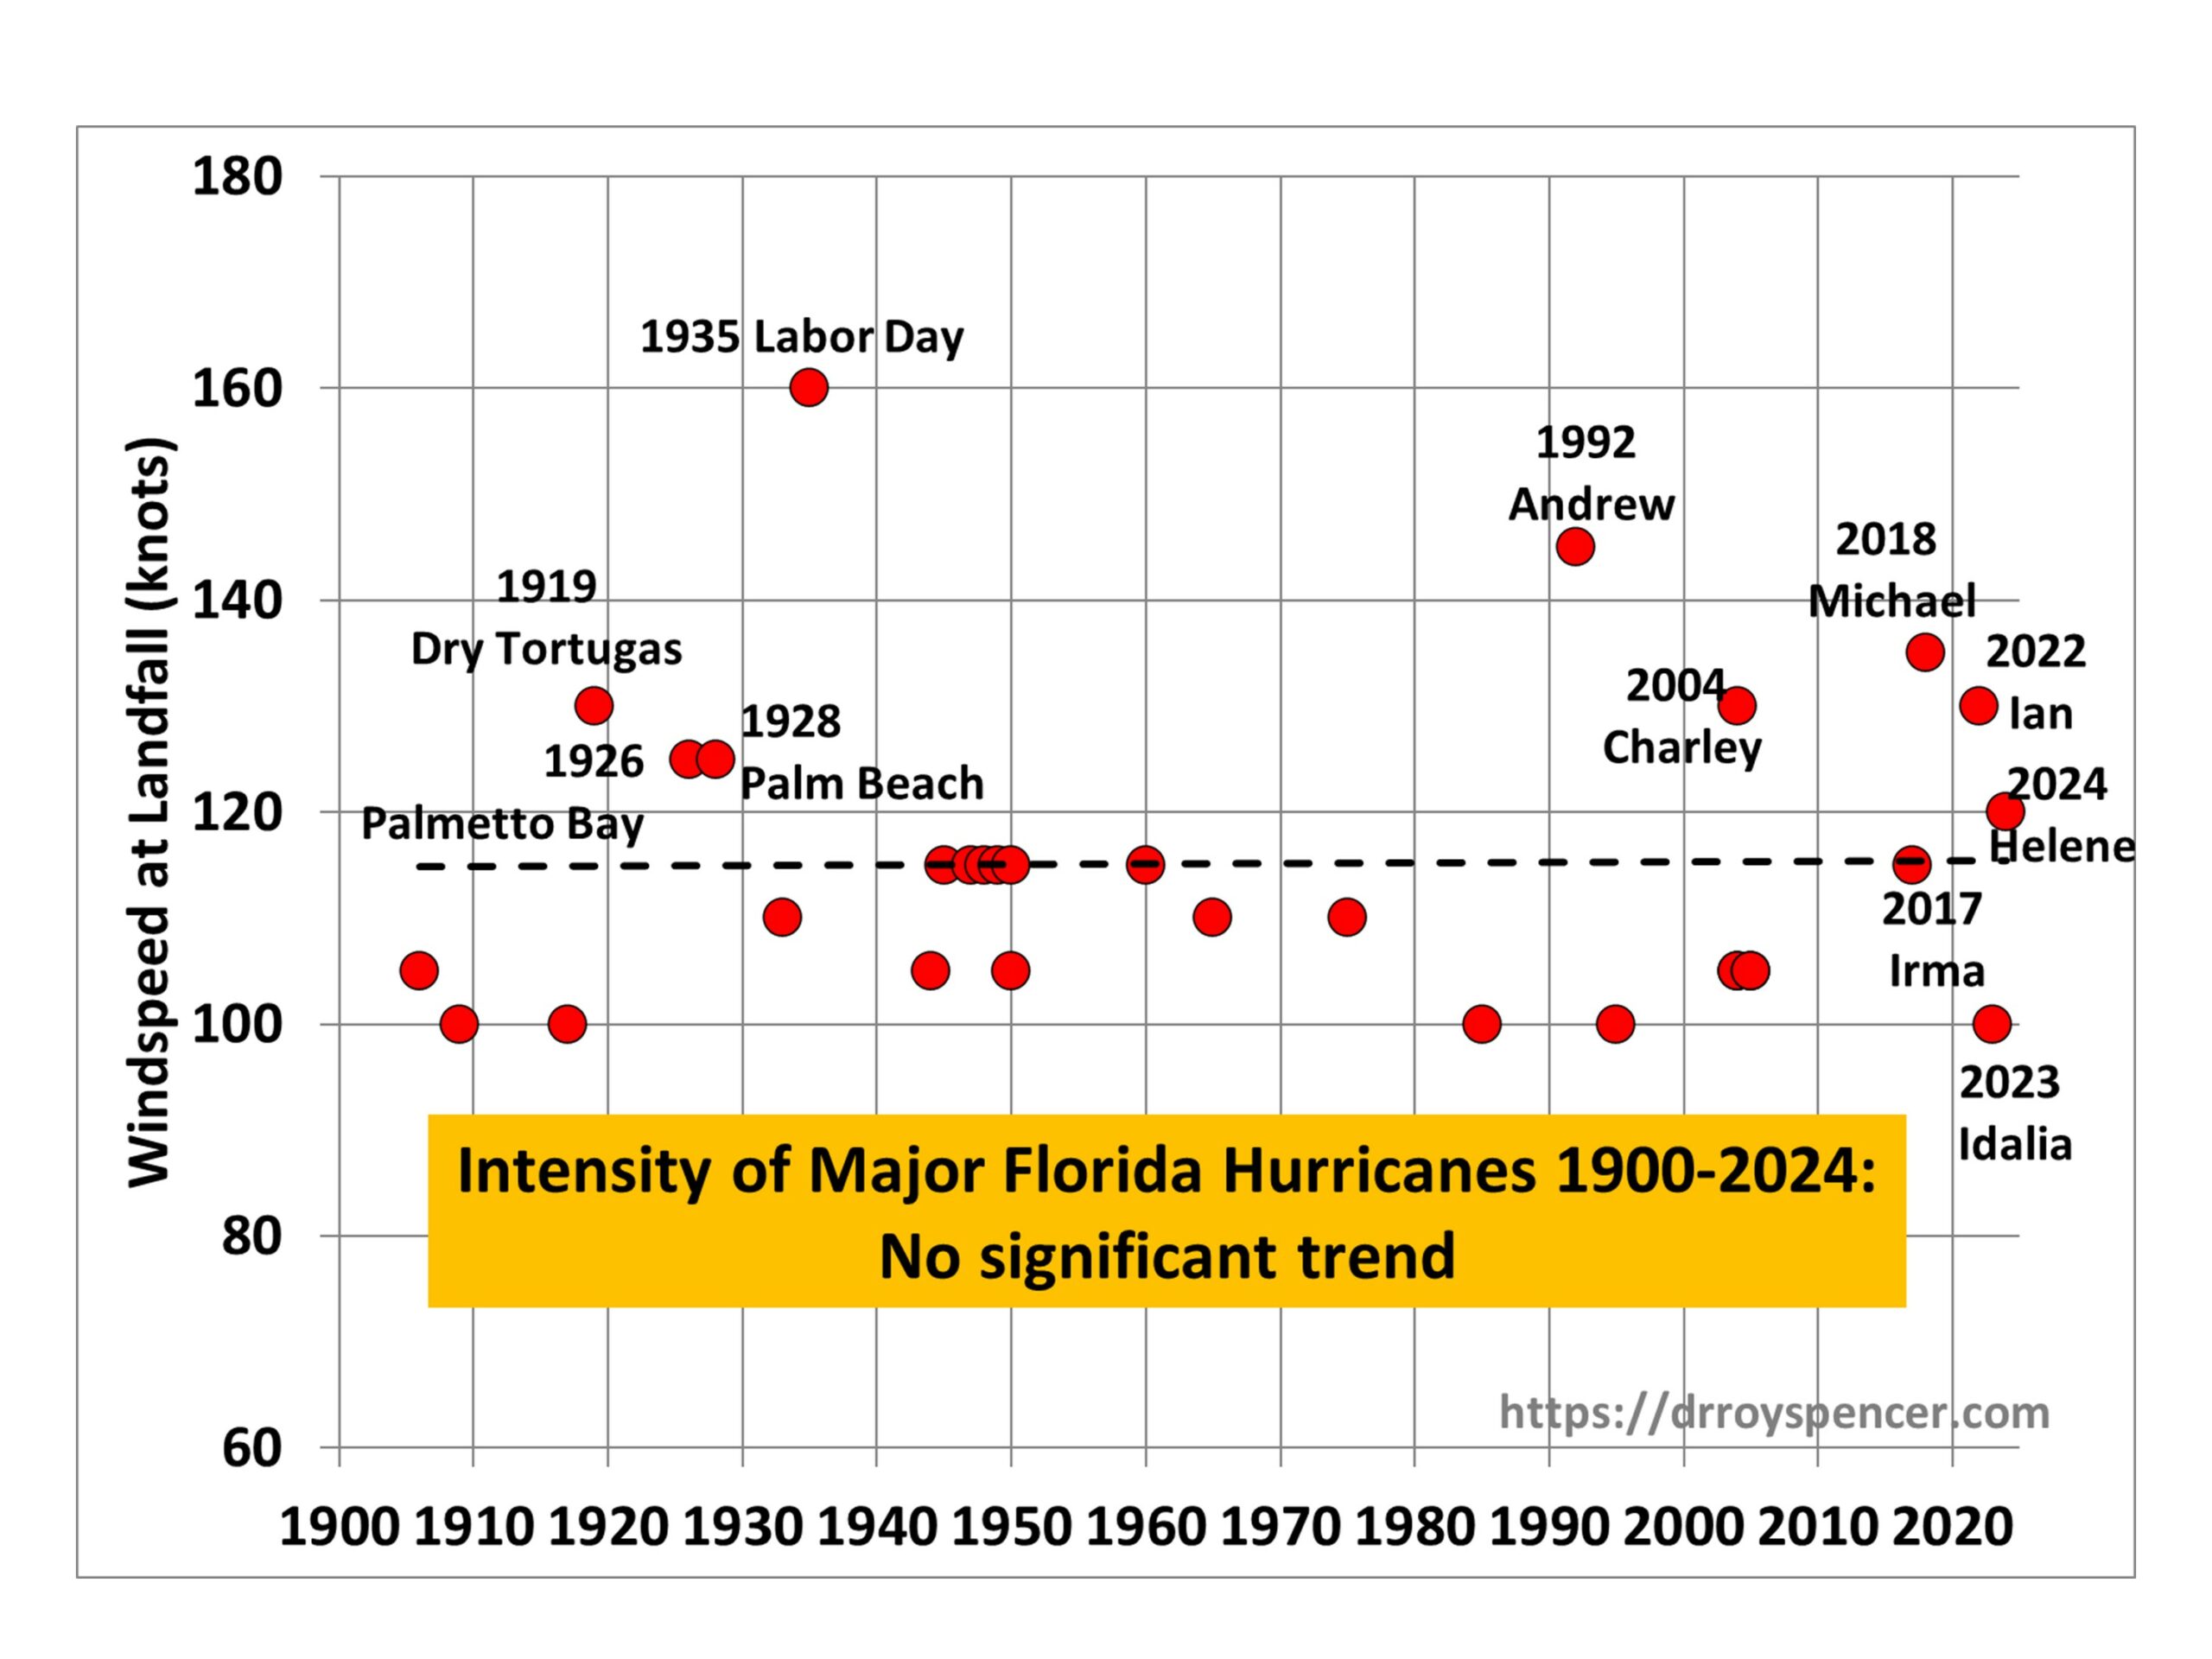
He goes through the regression arithmetic (without error) to yield the flat line shown. So no trend? This exciting result is already doing the rounds.

The problem is one of censored data. Regression allows you to have data y with irregular spacing in t, on the assumption that there is a linear model
y=a*t+b+ε
where a and b are parameters that you estimate by fitting, and ε is a set of random residuals with mean zero (you can also estimate the sd). Put another way, the assumption is that missing data is statistically similar to the data sampled.

But here the missing years are not like that. We don't know the numbers (they were below Wiki's cut-off) but we know they were less than 100. That is what censored data means. And that just doesn't fit with the regression model.

You can see this with a simple case. Suppose we had just the 1935 hurricane, at 160 mph, and the 1992 one at 145 mph. Regression would give a down trend. But then you include the 1933 hurricane at 110. That is another big hurricane back then, so it should lower the trend further, no? No! The regression effectively averages the two to 135 mph, so now there is an uptrend. The reason is that the first regression assumed the 1933 value would be about 160. When it finds out that it is much lower, the trend goes up. And if it found out that 1934 was even lower, the trend would go up even further. And of course we do know that 1934 was less than 100.

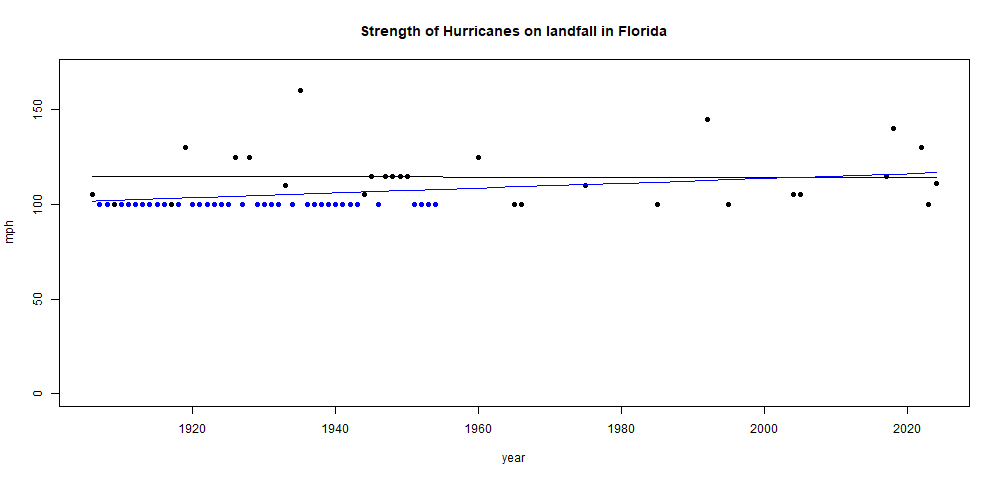
This might seem like an artefact of too few data. So let's see it played out on a larger scale. Suppose in every year from 1906 to 1955, when there wasn't a major hurricane, we add one with strength 100 mph. That has to mean that the past was windier, right? And the trend is more negative. But no, the trend goes from Roy's -0.002 mph/year to 0.127 mph/year. Here is the plot, with trend and points after the strengthening of early hurricanes in blue:


So what is the right thing to do? I'm not an expert in censored data, so I don't know. But I do know this won't work. You can see intuitively that in the last 34 years, there have been 5 hurricanes greater than 118. There were only 4 in the previous 90.  That does indicate strengthening.

Roy did a second regression, on numbers of major hurricanes


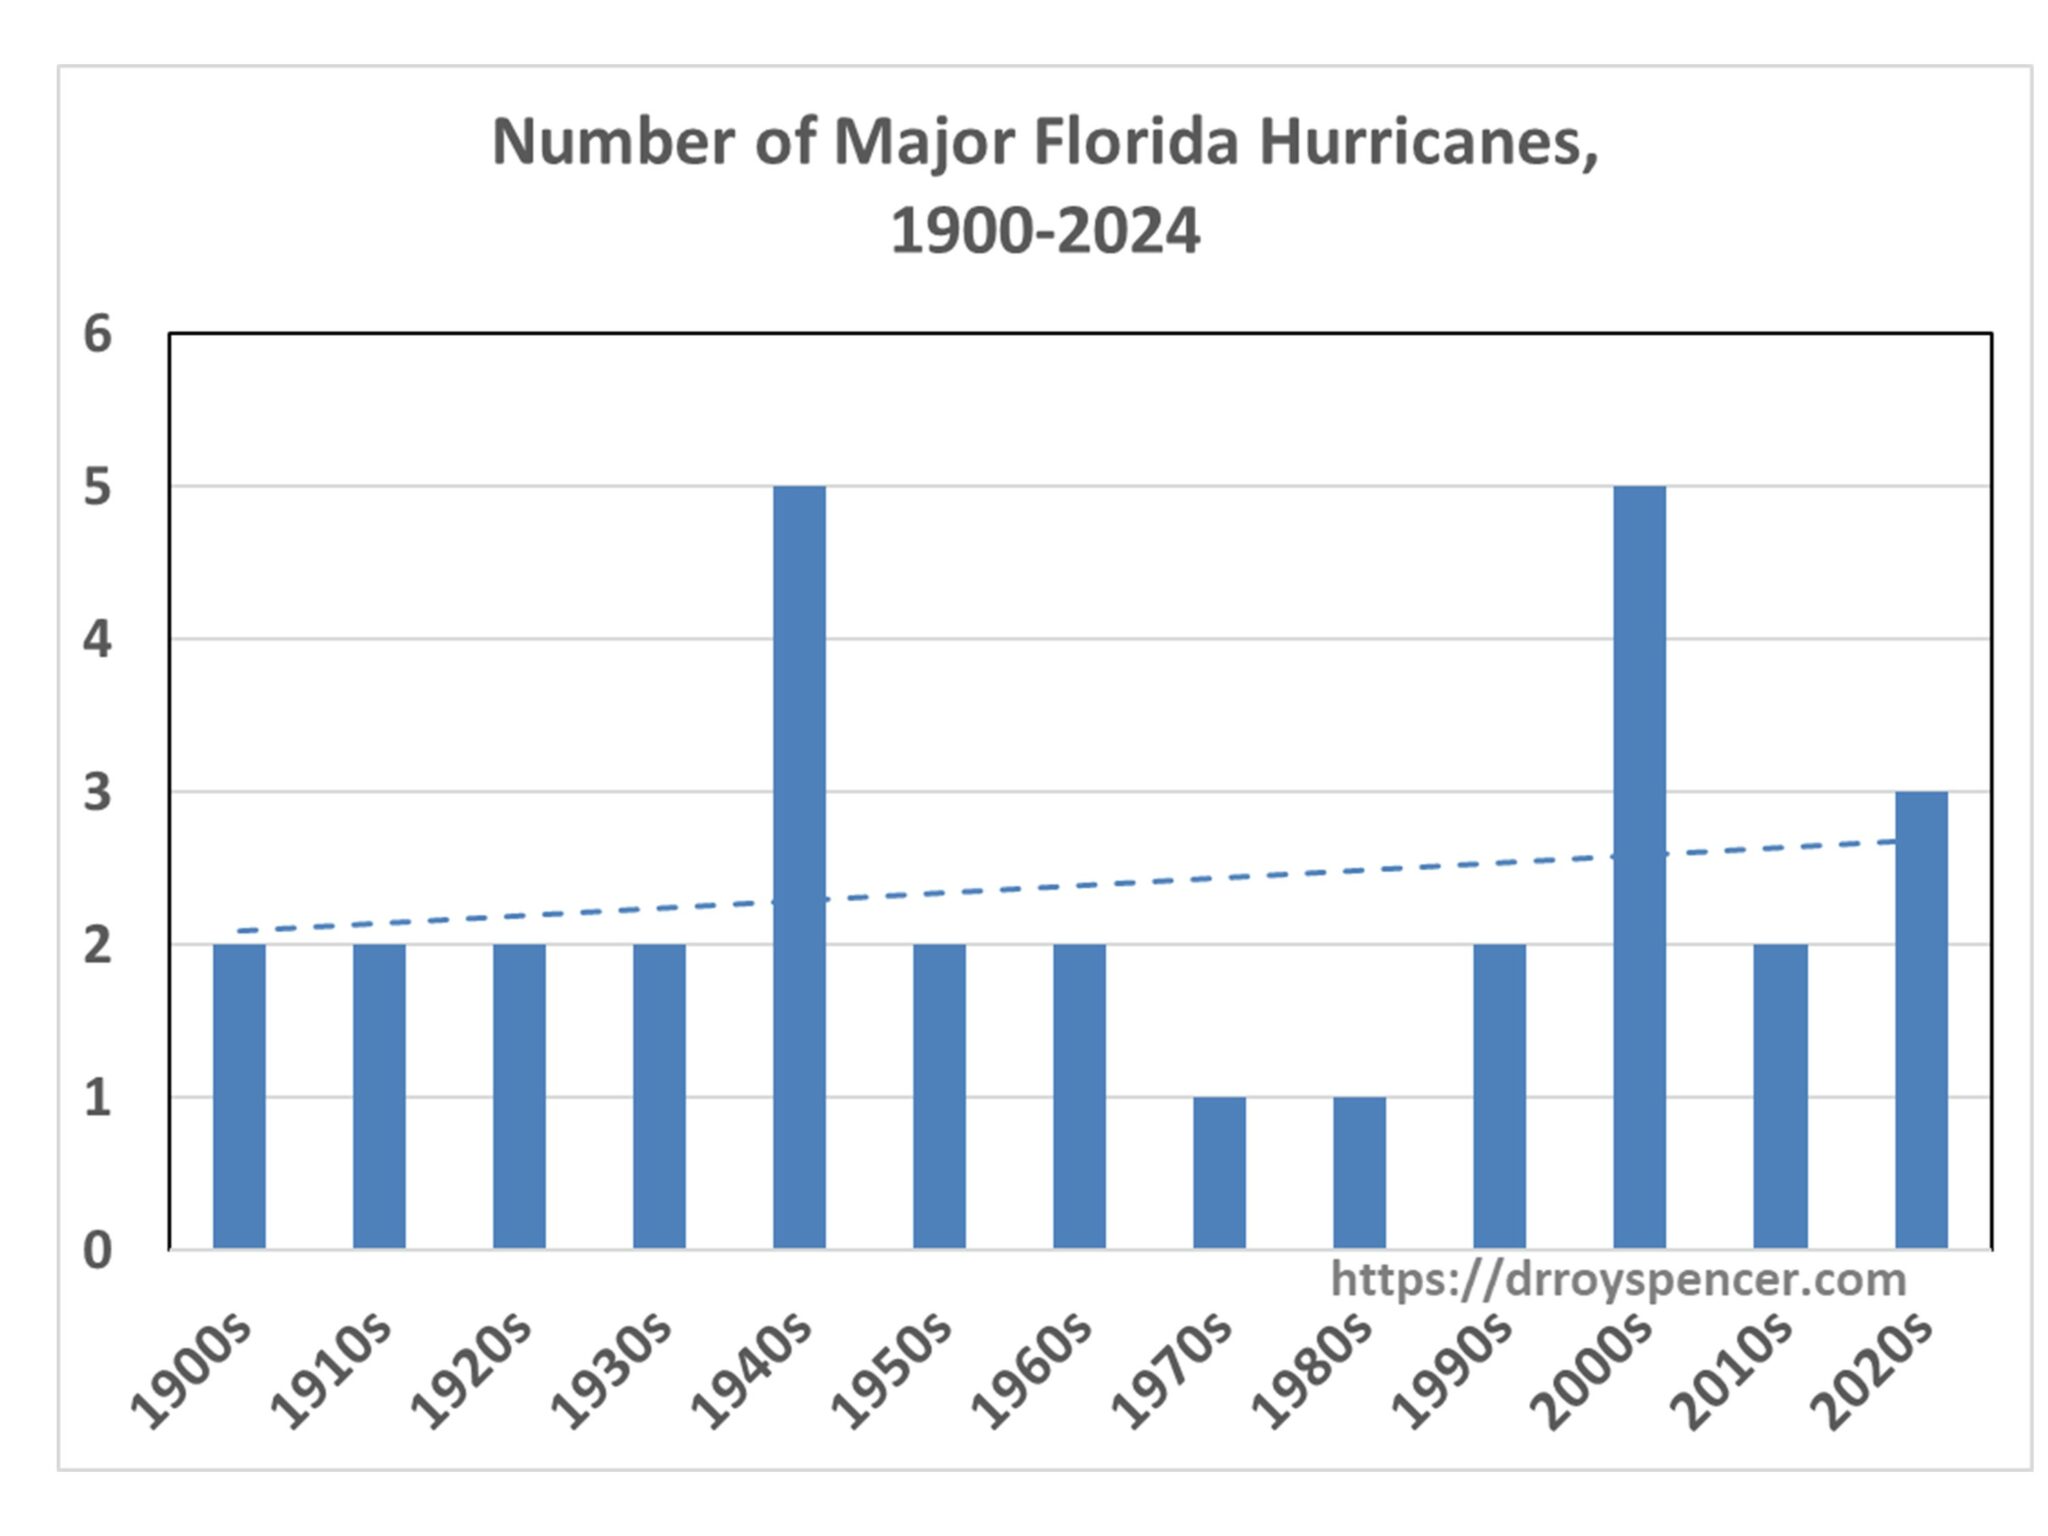
This doen't have the same objection, because of the binning into decades. There are no missing data (except in the last decade). Years that had no major hurricanes were correctly assigned value zero in the binning. And yes, the trend is up. So this plot is not the one that is circulating.

Thursday, September 12, 2024

GISS August global temperature up by 0.09°C from July.

The GISS V4 land/ocean temperature anomaly was 1.3°C in August, up from 1.21°C in July. This rise was similar to the 0.065°C rise reported here for TempLS.

As with TempLS, August was the warmest August in the record - next was 1.19°C in 2023.

As usual here, I will compare the GISS and earlier TempLS plots below the jump.

Sunday, September 8, 2024

August global surface TempLS up 0.065°C from July, warmest August in record.

The TempLS FEM anomaly (1961-90 base) was 1.161°C in August, up from 1.096°C in July. It was, by a small margin, the warmest August in the record, ahead of 1.108°C in 2023. That makes 15 record months in a row, which is an amazing run.

Here is the corresponding stacked graph, showing how much hotter recent months have been:


Here is the temperature map, using the FEM-based map of anomalies. Use the arrows to see different 2D projections.


As always, the 3D globe map gives better detail. There are more graphs and a station map in the ongoing report which is updated daily.

Sunday, August 11, 2024

GISS July global temperature down by 0.04°C from June.

The GISS V4 land/ocean temperature anomaly was 1.21°C in July, down from 1.25°C in June. This fall contrasts with the tie reported here for TempLS.

As with TempLS, July was by a whisker the warmest July in the record - next was 1.19°C in 2023.

As usual here, I will compare the GISS and earlier TempLS plots below the jump.

Thursday, August 8, 2024

July global surface TempLS up 0.001°C from June, warmest July in record.

The TempLS FEM anomaly (1961-90 base) was 1.084°C in July, up from 1.083°C in June. This of course is a virtual tie, and could be reversed with further data It was, by a whisker, the warmest July in the record, ahead of 1.072°C in 2023. That makes 14 record months in a row.

Here is the corresponding stacked graph, showing how much hotter recent months have been:


Here is the temperature map, using the FEM-based map of anomalies. Use the arrows to see different 2D projections.


As always, the 3D globe map gives better detail. There are more graphs and a station map in the ongoing report which is updated daily.

Thursday, July 11, 2024

GISS June global temperature up by 0.05°C from May.

The GISS V4 land/ocean temperature anomaly was 1.21°C in June, up from 1.16°C in May. This rise is similar to the 0.03°C reported here for TempLS.

As with TempLS, June was the warmest June in the record - next was 1.08°C in 2023.

As usual here, I will compare the GISS and earlier TempLS plots below the jump.

Monday, July 8, 2024

June global surface TempLSup 0.030°C from May, warmest June in record.

The TempLS FEM anomaly (1961-90 base) was 1.059°C in June, up from 1.029°C in May. It was the warmest June in the record, ahead of 0.95°C in 2023. The NCEP/NCAR reanalysis base index fell by 0.013°C.

That makes 13 record months in a row; and June 2024 is even close to July 2023, so it may not be the last of this run. It is looking even more likely that 2024 will be a record warm year, well ahead even of 2023.

Here is the corresponding stacked graph, showing how much hotter recent months have been:


Here is the temperature map, using the FEM-based map of anomalies. Use the arrows to see different 2D projections.


As always, the 3D globe map gives better detail. There are more graphs and a station map in the ongoing report which is updated daily.

Saturday, June 15, 2024

GISS May global temperature down by 0.19°C from April.

The GISS V4 land/ocean temperature anomaly was 1.14°C in May, down from 1.33°C in April. This fall is similar to the 0.168°C reported here for TempLS.

As with TempLS, May was the warmest May in the record - next was 1.01°C in 2020.

I mentioned in the earlier post that the TempLS was made on a reduced number of stations that had reported.    Even now only 3303 non-US stations have reported, whereas last year there would have been over 4000. So it seems to be a permament change.

As usual here, I will compare the GISS and earlier TempLS plots below the jump.

Wednesday, June 12, 2024

GHCN V4 changes.

AS I mentioned in my previous post, GHCN results have been coming through more slowly. I have been following a rule for posting, that I wait for 3800 non-US land stations to report. In April I was a little short, but in May, only 3320 stations by the 11th. So I investigated to see what is going on.
 
It seems that just a few countries are reporting a lot fewer stations than before; specifically, Canada, Australia and Scandinavian countries. It could be said that their previous roster of stations was excessive, but this is a drastic change. Here is a table of the recent numbers of leading countries:
May23JanFebMarAprMay
USA636563086333625162204867
Non-US Total488844974588439439123319
CAN872774883872724164
RUS500532545543510504
SWE2062042051841010
CHINA20020119987200201
GER167168168169160160
FIN1681651691692929
JAP59150150150150150
AUS540133133139137136
NOR1091111101102122
SPAIN98100100978484
INDO939292989299

The US is low but that may be temporary, and anyway, it has far more than needed. But Canada is way down, and Australia has been down all this year. Sweden, Finland and Norway have been down for two months, but the coverage before was excessive. So I'm not worried about the change - I just note it.
To see what this looks like in detail, here is my home state of Victoria in April 2023, and then in April 2024:

Before the change, there were 9 stations in the Melbourne metro area, now just two, which seems reasonable. But it leaves most of the Victoria interior without data.
 
Anyway, for now I'll use data from 3200 non-US stations as the trigger for posting.

Tuesday, June 11, 2024

May global surface TempLS down 0.168°C from April, but still warmest May in record.

The TempLS FEM anomaly (1961-90 base) was 1.013°C in May, down from 1.181°C in April. It was still the warmest May in the record, ahead of 0.859°C in 2020. The NCEP/NCAR reanalysis base index fell by 0.044°C.

I'm late posting this month. GHCN data has been slow coming in. I have rules for posting, the most critical is that there be 3800 land stations outside US. But this month there are only 3320 so far. It seems to be a long term change, so there is not much point in waiting longer. The deficit is in just a few countries which were previously very well covered, so it may be by design. Anyway, I'll write a post later today analysing that.

Here is the corresponding stacked graph, showing how much hotter recent months have been:


Here is the temperature map, using the FEM-based map of anomalies. Use the arrows to see different 2D projections.


As always, the 3D globe map gives better detail. There are more graphs and a station map in the ongoing report which is updated daily.

Tuesday, May 21, 2024

High resolution SST and movies of critical regions

About twelve years ago I did quite a lot of work with NOAA's AVHRR data on sea surface temperature anomaly. I wrote about it here and maintained an updated page here, with an active trackball globe. I then extracted certain regions of interest and posted movies of specific periods. This required projection from the sphere onto a flat surface.

All this was prepared in R and implemented in Javascript/WebGL. It worked, but was then at the limit of my skills and computing infrastructure, and some things stopped working after a while, and were difficult to fix. So I have done a complete re-write. I think the interface is more usable, and updating will be better.

The page is here. The standard movie controls are below the image, also shown below. The regions are:
  • E for tropical Pacific, intended to show ENSO effects
  • A for Arctic, centered on Pole
  • E for Antarctic, centered on Pole
  • N for Notrh Atlantic
  • P for North Pacific

You can choose one of the time intervals stated, click a radio button, and use the movie control to start and pause. Below the selection buttons is a slider to vary the frame speed. Default is 5 Hz, but the log scale goes from 1 to 25. The last row of buttons has about 800 frames at 4 day intervals, so you may want to speed up.


Sunday, May 12, 2024

GISS April global temperature down by 0.07°C from March.

The GISS V4 land/ocean temperature anomaly was 1.32°C in April, down from 1.39°C in March. This fall is larger than the virtual tie reported here for TempLS.

As with TempLS, April was the warmest April in the record - next was 1.13°C in 2020.

As usual here, I will compare the GISS and earlier TempLS plots below the jump.

Thursday, May 9, 2024

April global surface TempLS down 0.004°C from March, but still warmest April in record.

The TempLS FEM anomaly (1961-90 base) was 1.178°C in April, very slightly down from 1.182°C in March. It was still the warmest April in the record, ahead of 1.009°C in 2020. The NCEP/NCAR reanalysis base index fell by 0.077°C.


Here is the corresponding stacked graph, showing how much hotter recent months have been:


Here is the temperature map, using the FEM-based map of anomalies. Use the arrows to see different 2D projections.


As always, the 3D globe map gives better detail. There are more graphs and a station map in the ongoing report which is updated daily.

Friday, April 12, 2024

GISS March global temperature down by 0.05°C from February.

The GISS V4 land/ocean temperature anomaly was 1.39°C in March, down from 1.44°C in February. This fall is smaller than the 0.11°C fall reported for TempLS.

As with TempLS, March was the warmest March in the record - next was 1.35°C in 2016. It was the fourth warmest month of all kinds.

As usual here, I will compare the GISS and earlier TempLS plots below the jump.

Monday, April 8, 2024

March global surface TempLS down 0.11°C from February, but still warmest March in record.

The TempLS FEM anomaly (1961-90 base) was 1.174°C in March, down from 1.284°C in February. It was still the warmest March in the record, just ahead of 1.138°C in 2016. The NCEP/NCAR reanalysis base index fell by 0.097°C.


Here is the corresponding stacked graph, showing how much hotter recent months have been, as well as the now completed year of 2023:


Here is the temperature map, using the FEM-based map of anomalies. Use the arrows to see different 2D projections.


As always, the 3D globe map gives better detail. There are more graphs and a station map in the ongoing report which is updated daily.

Wednesday, March 13, 2024

GISS February global temperature up by 0.22°C from January.

The GISS V4 land/ocean temperature anomaly was 1.44°C in February, up from 1.35°C in January. This rise is larger than the 0.165°C rise reported for TempLS.

As with TempLS, February was the warmest February in the record - next was 1.37°C in 2016.

As usual here, I will compare the GISS and earlier TempLS plots below the jump.

Thursday, March 7, 2024

February global surface TempLS up 0.163°C from January; warmest February in record.

The TempLS FEM anomaly (1961-90 base) was 1.256°C in February, up from 1.093°C in January. It was the warmest February in the record, ahead of 1.16°C in 2016. The NCEP/NCAR reanalysis base index rose by 0.061°C.

It was very warm in N America, most of Europe, and the Arctic. Cold patches in Central Asia and far NE Siberia. Antarctica was cold.
Here is the temperature map, using the FEM-based map of anomalies. Use the arrows at bottom to see different 2D projections.


As always, the 3D globe map gives better detail. There are more graphs and a station map in the ongoing report which is updated daily.


Here is the updated stacked plot of monthly values

Tuesday, February 13, 2024

GISS January global temperature down by 0.14°C from December.

The GISS V4 land/ocean temperature anomaly was 1.21°C in January, up from 1.35°C in December. This fall is similar to the 0.165°C fall reported for TempLS.

As with TempLS, January was still by a small margin the warmest January in the record - next was 1.18°C in 2016.

As usual here, I will compare the GISS and earlier TempLS plots below the jump.

Wednesday, February 7, 2024

January global surface TempLS down 0.165°C from December, but still warmest January in record.

The TempLS FEM anomaly (1961-90 base) was 1.062°C in January, down from 1.227°C in December. It was still he warmest January in the record, but only just ahead of 0.982°C in 2016. This is the first time since May that the month was not warmest by a long way. The NCEP/NCAR reanalysis base index fell by 0.141°C.

It was very warm in NE N America, but cold in a band from the Gulf Coast to Alaska. Cold in N Europe and far East Siberia, but a band of warmth through N Africa to central Siberia. Antarctica was cold.
Here is the temperature map, using the FEM-based map of anomalies. Use the arrows at bottom to see different 2D projections.


As always, the 3D globe map gives better detail. There are more graphs and a station map in the ongoing report which is updated daily.

Sunday, January 14, 2024

GISS December global temperature down by 0.06°C from November.

The GISS V4 land/ocean temperature anomaly was 1.37°C in December, down from 1.43°C in November. This fall is very similar to the 0.064°C fall reported for TempLS.

As with TempLS, December was still by a large margin the warmest December in the record - next was 1.16°C in 2015.

As usual here, I will compare the GISS and earlier TempLS plots below the jump.

Tuesday, January 9, 2024

Graphics to show magnitude of 2023 warming.

My previous post, with the December anomaly average, completed the years results and confirmed what has been obvious for a while, that 2023 is the hottest year that has been measured. It was 0.158°C warmer than 2016, the next warmest year, which itself stood above previous years.

I'd like here to collect some graphics which will put this into proportion. It comes from a collection (for various indices) that I am updating and posting on the data page. The first is oneof a kind that I show whenever there is a record year. It is just a bar chart of the temperatures, but colored in a way that shows the progress of the record values:

The second is one that I have been showing for a while. It is a stacked graph of monthly and annual temperatures. It is like a bar chart, but the months have been gathered in one slot, and arranged in order of size, tallest at the back. Annual is shown as well. Since June, 2023 towers over the rest:

And here is a graph with a different ordering, by time, newest at the back. Each rectangle you now see was a record in its time, so gives an idea of how record setting 2023 was. 2016 was not so far behind, but based on just four very warm months. However, there is a calendar effect here. The 2015/6 peak was split between two years; taken together, they were actually larger than 2023, as you see from the annual column. Still, the current one isn't finished by any means.

Monday, January 8, 2024

December global surface TempLS down 0.064°C from November, but still warmest December in record.

The TempLS FEM anomaly (1961-90 base) was 1.214°C in December, down from 1.278°C in November. It was still by far the warmest December in the record by 0.229°C, ahead of 0985°C in 2015. The NCEP/NCAR reanalysis base index rose by 0.031°C.

It confirms 2023 as the hottest year in the record; I'll write more about that with graphics in a coming post. I have added a gallery of graphics to the data page here. For now, I'll just show the stacked graph of monthly temperatures, to show how the last seven months stand out:

Here is the corresponding stacked graph, showing how much hotter recent months have been, as well as the now completed year of 2023:


North America was very warm. Scandinavia was cold, as was a section of East Siberia. Antarctica was cold.
Here is the temperature map, using the FEM-based map of anomalies. Use the arrows to see different 2D projections.


As always, the 3D globe map gives better detail. There are more graphs and a station map in the ongoing report which is updated daily.