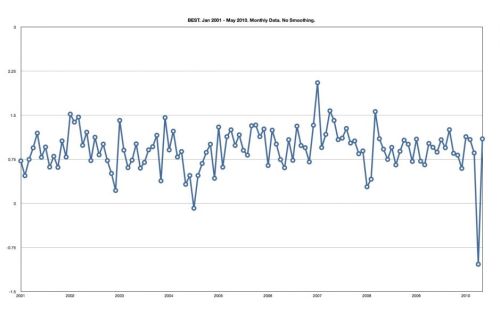
BEST extended its temperature series back a lot further than its predecessors, to about 1800. Many have assumed that this was because they have more early data, but this is not true. Their data set in this period is pretty much identical with GHCN.
You can see this from the
KMZ file or the
interactive Javascript plot. But I thought I should check it out in detail, so I have below a table of the actual stations, in one case from GHCNV2 (V3 is the same) and in the other BEST, taken from their data.txt file.
There are very few discrepancies. Out of about 275 pre-1850 stations, I count only 6 which BEST has and GHCN doesn't. There seem to be 9 than GHCN has that BEST doesn't, and 8 that BEST has included apparently twice. Details below the jump.
Here is a complete table of stations with pre-1850 data.. The color scheme is:
| Black | BEST
|
| Red | GHCN
|
| Purple | BEST unique
|
| Blue | GHCN unique
|
| Green | BEST duplicate
|
The first table is just of the exceptions. I have colored STYKKISHOLMU but not counted it, because it is in both, though BEST seems to have about 20 more years data. Generally I did not color if there is a discrepancy of less than three years in start date. I have shortened names to 12 characters.
| Name | Lat | Lon | Alt | Start | End
|
| BERLIN-DAHLE | 52.47 | 13.3 | 58 | 1769 | 2009
|
| Wien - Hohe | 48.2 | 16.4 | 203 | 1775 | 2009
|
| UCCLE BELGIU | 50.8 | 4.4 | 100 | 1794 | 2009
|
| SHIP V | 34 | 164 | -999 | 1808 | 1829
|
| EAST MILTON | 42.22 | -71.12 | 193 | 1811 | 2010
|
| KIEV GMO | 50.4 | 30.53 | 170 | 1812 | 2010
|
| SAMSUN | 41.28 | 36.33 | 4 | 1819 | 2010
|
| FORT SNILLIN | 44.9 | -93.2 | 245 | 1820 | 1982
|
| NEW YORK AVE | 40.63 | -73.96 | 7 | 1822 | 2009
|
| CHARLESTON I | 32.83 | -79.97 | 8 | 1823 | 2010
|
| STYKKISHOLMU | 65.08 | -22.72 | 10 | 1823 | 2010
|
| MACDILL AFB/ | 27.85 | -82.52 | 6 | 1825 | 2010
|
| ITHACA CORNE | 42.46 | -76.46 | 292 | 1827 | 2010
|
| KIRKWALL | 59 | -2.9 | 26 | 1827 | 2009
|
| Helsinki/Kai | 60.2 | 25 | 4 | 1829 | 2000
|
| BLUE HILL OB | 42.22 | -71.12 | 195 | 1831 | 2006
|
| STENNIS INTE | 30.33 | -89.44 | 6 | 1833 | 2010
|
| WAVELAND | 30.3 | -89.38 | 2 | 1833 | 2006
|
| AMHERST | 42.38 | -72.53 | 45 | 1836 | 2010
|
| Graz-Univers | 47.1 | 15.5 | 366 | 1837 | 2001
|
| SALZBURG-FLU | 47.8 | 13 | 439 | 1842 | 2010
|
| WEST CHESTER | 39.97 | -75.63 | 137 | 1843 | 2006
|
| STYKKISHOLMU | 65.08 | -22.73 | 8 | 1846 | 2010
|
| SAN FRANCISC | 37.62 | -122.38 | 5 | 1847 | 2010
|
| SATA FE COUN | 35.64 | -106.03 | 2039 | 1849
|
And here is the full table, including exceptions, ordered by start date:
| Name | Lat | Lon | Alt | Start | End
|
| BERLIN-DAHLE | 52.48 | 13.35 | 52 | 1701 | 2010
|
| BERLIN-TEMPE | 52.47 | 13.4 | 49 | 1701 | 2010
|
| DE BILT | 52.1 | 5.19 | 6 | 1706 | 2010
|
| DE BILT | 52.1 | 5.18 | 15 | 1706 | 2010
|
| UPPSALA & | 59.88 | 17.6 | 24 | 1739 | 2010
|
| UPPSALA | 59.88 | 17.6 | 41 | 1739 | 1970
|
| BOSTON LOGAN | 42.36 | -71.04 | 6 | 1743 | 2010
|
| BOSTON/LOGAN | 42.37 | -71.03 | 9 | 1743 | 2010
|
| LENINGRAD /T | 59.97 | 30.3 | 4 | 1743 | 2010
|
| ST.PETERBURG | 59.97 | 30.3 | 6 | 1743 | 2010
|
| TURKU | 60.52 | 22.28 | 56 | 1750 | 2010
|
| TURKU | 60.52 | 22.27 | 59 | 1750 | 2010
|
| GENEVE-COINT | 46.25 | 6.12 | 420 | 1753 | 2010
|
| GENEVE-COINT | 46.25 | 6.13 | 416 | 1753 | 2010
|
| LUNDSWEDEN | 55.7 | 13.2 | 73 | 1753 | 1773
|
| LUNDSWEDEN | 55.7 | 13.2 | 73 | 1753 | 1773
|
| TORINO/CASEL | 45.22 | 7.65 | 287 | 1753 | 1981
|
| TORINO/CASEL | 45.22 | 7.65 | 287 | 1753 | 1981
|
| BASEL/BINNIN | 47.6 | 7.6 | 317 | 1755 | 1990
|
| BASEL/BINNIN | 47.6 | 7.6 | 318 | 1755 | 1980
|
| STOCKHOLM/BR | 59.33 | 18.03 | 40 | 1756 | 2010
|
| STOCKHOLM | 59.33 | 18.05 | 52 | 1756 | 1994
|
| FRANKFURT A | 50.1 | 8.7 | 109 | 1757 | 1961
|
| FRANKFURT A | 50.1 | 8.7 | 109 | 1757 | 1961
|
| PARIS/LE BOU | 48.82 | 2.42 | 62 | 1757 | 2010
|
| PARIS/LE BOU | 48.8 | 2.5 | 53 | 1757 | 1995
|
| PHILADELPHIA | 39.87 | -75.23 | 6 | 1758 | 2010
|
| PHILADELPHIA | 40 | -75.2 | 9 | 1758 | 2010
|
| LEIPZIG E.GE | 51.4 | 12.4 | 137 | 1759 | 1935
|
| LEIPZIG E.GE | 51.4 | 12.4 | 137 | 1759 | 1935
|
| TRONDHEIM/TY | 63.4 | 10.45 | 115 | 1761 | 1981
|
| TRONDHEIM/TY | 63.4 | 10.5 | 115 | 1761 | 1981
|
| GREENWICH/MA | 51.5 | 0 | 7 | 1763 | 1969
|
| GREENWICH/MA | 51.5 | 0 | 7 | 1763 | 1969
|
| MILANO/LINAT | 45.43 | 9.29 | 103 | 1763 | 2010
|
| MILANO/LINAT | 45.43 | 9.28 | 103 | 1763 | 1987
|
| EDINBURGH/RO | 55.9 | -3.2 | 134 | 1764 | 1990
|
| EDINBURGH/RO | 55.9 | -3.2 | 134 | 1764 | 1960
|
| KREMSMUENSTE | 48.05 | 14.12 | 385 | 1767 | 2010
|
| KREMSMUENSTE | 48.05 | 14.13 | 389 | 1767 | 2010
|
| CHURCHILL FA | 58.8 | -94 | 287 | 1768 | 1847
|
| CHURCHILL FA | 58.8 | -94 | 287 | 1768 | 1858
|
| KOBENHAVN/LA | 55.68 | 12.54 | 9 | 1768 | 2010
|
| KOBENHAVN/ | 55.68 | 12.55 | 9 | 1768 | 2010
|
| BERLIN-DAHLE | 52.47 | 13.3 | 58 | 1769 | 2009
|
| JENAE.GERMAN | 50.9 | 11.6 | 155 | 1770 | 1935
|
| JENAE.GERMAN | 50.9 | 11.6 | 155 | 1770 | 1935
|
| PRAHA/RUZYNE | 50.1 | 14.25 | 365 | 1771 | 2010
|
| PRAHA/RUZYNE | 50.1 | 14.25 | 365 | 1771 | 2009
|
| REGENSBURG | 49.05 | 12.1 | 371 | 1773 | 2010
|
| REGENSBURG | 49.05 | 12.1 | 371 | 1773 | 2010
|
| YORK FACTORY | 57 | -92.3 | 86 | 1774 | 2004
|
| YORK FACTORY | 57 | -92.3 | 126 | 1774 | 1910
|
| Wien - Hohe | 48.2 | 16.4 | 203 | 1775 | 2009
|
| WIEN/HOHE WA | 48.26 | 16.37 | 207 | 1775 | 2010
|
| WIEN/HOHE WA | 48.25 | 16.37 | 209 | 1775 | 2010
|
| OULU FINLAND | 64.94 | 25.41 | 14 | 1776 | 2010
|
| OULU | 64.93 | 25.37 | 15 | 1776 | 2010
|
| INNSBRUCK/UN | 47.27 | 11.39 | 584 | 1777 | 2010
|
| INNSBRUCK/UN | 47.3 | 11.4 | 582 | 1777 | 2000
|
| VIL'NJUS U.S | 54.63 | 25.23 | 160 | 1777 | 2010
|
| VILNIUS | 54.63 | 25.1 | 156 | 1777 | 2010
|
| KARLSRUHEGER | 49.03 | 8.38 | 130 | 1779 | 2008
|
| KARLSRUHE | 49.03 | 8.37 | 145 | 1779 | 2008
|
| MOSKOW AGRO | 55.8 | 37.6 | 158 | 1779 | 2010
|
| MOSKVA | 55.83 | 37.62 | 156 | 1779 | 2010
|
| WARSZAWA-OKE | 52.17 | 20.97 | 107 | 1779 | 2010
|
| WARSZAWA-OKE | 52.17 | 20.97 | 107 | 1779 | 2010
|
| BUDAPEST/MET | 47.52 | 19.03 | 129 | 1780 | 1995
|
| BUDAPEST/ | 47.52 | 19.03 | 129 | 1780 | 1991
|
| PADOVA (CIV/ | 45.4 | 11.85 | 14 | 1780 | 1990
|
| PADOVA | 45.4 | 11.85 | 14 | 1780 | 1827
|
| GORDON CASTL | 57.6 | -3.1 | 32 | 1781 | 1975
|
| GORDON CASTL | 57.6 | -3.1 | 32 | 1781 | 1975
|
| HOHENPEISSEN | 47.8 | 11.02 | 979 | 1781 | 2010
|
| HOHENPEISSEN | 47.8 | 11.02 | 986 | 1781 | 2010
|
| MUNCHEN/RIEM | 48.1 | 11.7 | 529 | 1781 | 1992
|
| MUNCHEN/RIEM | 48.1 | 11.7 | 529 | 1781 | 1991
|
| NEW HAVEN UN | 41.3 | -72.9 | 7 | 1781 | 1992
|
| NEW HAVEN/TW | 41.3 | -72.9 | 7 | 1781 | 1970
|
| MONTDIDIERFR | 49.7 | 2.6 | 90 | 1784 | 1869
|
| MONTDIDIERFR | 49.7 | 2.6 | 90 | 1784 | 1869
|
| TOULOUSE BLA | 43.63 | 1.38 | 152 | 1784 | 2010
|
| TOULOUSE/BLA | 43.63 | 1.37 | 153 | 1784 | 2010
|
| PAMPLEMOUSSE | -20.1 | 57.57 | 55 | 1787 | 1960
|
| TRIER-PETRIS | 49.75 | 6.67 | 237 | 1788 | 2010
|
| TRIER-PETRIS | 49.75 | 6.67 | 273 | 1788 | 2010
|
| VERONA-VILLA | 45.38 | 10.87 | 68 | 1788 | 2010
|
| VERONA/VILLA | 45.38 | 10.87 | 68 | 1788 | 2005
|
| PALERMO ITAL | 38.1 | 13.4 | 229 | 1791 | 1868
|
| PALERMO ITAL | 38.1 | 13.4 | 229 | 1791 | 1868
|
| STUTTGART/CA | 48.83 | 9.2 | 314 | 1792 | 2000
|
| STUTTGART/ | 48.83 | 9.2 | 311 | 1792 | 2010
|
| WROCLAW II-S | 51.1 | 16.89 | 123 | 1792 | 2010
|
| WROCLAW II | 51.1 | 16.88 | 121 | 1792 | 2010
|
| MANCHESTER A | 53.35 | -2.29 | 75 | 1794 | 2004
|
| MANCHESTER A | 53.35 | -2.27 | 78 | 1794 | 2004
|
| UCCLE BELGIU | 50.8 | 4.4 | 100 | 1794 | 2009
|
| ALBANY COUNT | 42.75 | -73.8 | 86 | 1795 | 2010
|
| ALBANY/ALBAN | 42.75 | -73.8 | 89 | 1795 | 2006
|
| RIGA U.S.S.R | 56.96 | 24.06 | 9 | 1795 | 2010
|
| RIGA | 56.97 | 24.05 | 7 | 1795 | 1997
|
| MADRAS/MINAM | 13 | 80.18 | 16 | 1796 | 2010
|
| MINAMBAKKAM | 13 | 80.19 | 16 | 1796 | 2010
|
| NATCHEZ | 31.56 | -91.37 | 59 | 1799 | 2010
|
| NATCHEZ | 31.55 | -91.38 | 59 | 1799 | 2006
|
| WOROFINLAND | 63.2 | 22 | NA | 1800 | 1824
|
| WOROFINLAND | 63.2 | 22 | -999 | 1800 | 1824
|
| STRASBOURG-E | 48.55 | 7.63 | 154 | 1801 | 2010
|
| STRASBOURG | 48.55 | 7.63 | 154 | 1801 | 2010
|
| TORNEOFINLAN | 66.4 | 23.8 | NA | 1801 | 1832
|
| TORNEOFINLAN | 66.4 | 23.8 | -999 | 1801 | 1832
|
| UDINE/CAMPOF | 46 | 13.1 | 92 | 1803 | 2005
|
| UDINE/CAMPOF | 46 | 13.1 | 92 | 1803 | 2005
|
| LEOBSCHUTZCZ | 50.2 | 17.8 | 357 | 1805 | 1849
|
| LEOBSCHUTZCZ | 50.2 | 17.8 | 357 | 1805 | 1849
|
| CHALONS FRAN | 48.9 | 4.4 | 89 | 1806 | 1848
|
| CHALONS FRAN | 48.9 | 4.4 | 89 | 1806 | 1848
|
| NICE/COTE DA | 43.65 | 7.2 | 13 | 1806 | 2010
|
| NICE | 43.65 | 7.2 | 10 | 1806 | 2010
|
| TALLINN | 59.42 | 24.8 | 41 | 1806 | 2010
|
| TALLIN | 59.42 | 24.8 | 44 | 1806 | 2010
|
| GDANSK-WRZES | 54.4 | 18.6 | 12 | 1807 | 1982
|
| GDANSK-WRZES | 54.4 | 18.6 | 12 | 1807 | 1984
|
| BOLOGNA/BORG | 44.53 | 11.3 | 49 | 1808 | 1981
|
| BOLOGNA/BORG | 44.53 | 11.3 | 49 | 1808 | 1981
|
| MIKOLAIV | 47.03 | 31.95 | 50 | 1808 | 1990
|
| NIKOLAYEV | 47.01 | 31.96 | 52 | 1808 | 1998
|
| SHIP V | 34 | 164 | -999 | 1808 | 1829
|
| EAST MILTON | 42.22 | -71.12 | 193 | 1811 | 2010
|
| ROMA/CIAMPIN | 41.83 | 12.43 | 80 | 1811 | 1996
|
| ROMEITALY | 41.8 | 12.6 | 107 | 1811 | 1991
|
| KAZAN' | 55.72 | 49.23 | 95 | 1812 | 2010
|
| KAZAN' | 55.6 | 49.28 | 116 | 1812 | 2010
|
| KIEV GMO | 50.4 | 30.53 | 170 | 1812 | 2010
|
| KIEV | 50.4 | 30.5 | 179 | 1812 | 2009
|
| KYIV | 50.4 | 30.57 | 167 | 1812 | 2010
|
| NEW BEDFORD | 41.69 | -70.93 | 20 | 1812 | 2010
|
| NEW BEDFORD | 41.63 | -70.93 | 21 | 1812 | 2002
|
| ARHANGEL'SK | 64.55 | 40.56 | 8 | 1813 | 2010
|
| ARHANGEL'SK | 64.5 | 40.73 | 8 | 1813 | 2010
|
| AUGSBURGW.GE | 48.4 | 10.4 | 490 | 1813 | 2009
|
| AUGSBURGW.GE | 48.4 | 10.4 | 490 | 1813 | 1834
|
| KLAGENFURT-F | 46.65 | 14.34 | 458 | 1813 | 2010
|
| KLAGENFURT-F | 46.65 | 14.33 | 476 | 1813 | 2010
|
| BAYREUTHW.GE | 49.9 | 11.6 | 320 | 1814 | 1930
|
| BAYREUTHW.GE | 49.9 | 11.6 | 320 | 1814 | 1930
|
| BERGEN-FREDR | 60.38 | 5.31 | 30 | 1816 | 2010
|
| BERGEN/FREDR | 60.4 | 5.3 | 44 | 1816 | 2010
|
| CALCUTTA/ALI | 22.53 | 88.32 | 6 | 1816 | 2010
|
| CALCUTTA/ALI | 22.53 | 88.33 | 6 | 1816 | 2010
|
| OSLO-BLINDER | 59.92 | 10.71 | 95 | 1816 | 2010
|
| OSLO/BLINDER | 59.9 | 10.7 | 96 | 1816 | 1991
|
| PETROZAVODSK | 61.82 | 34.28 | 82 | 1816 | 2010
|
| PETROZAVODSK | 61.82 | 34.27 | 110 | 1816 | 2010
|
| TRENTOITALY | 46.1 | 11.1 | 312 | 1816 | 1866
|
| TRENTOITALY | 46.1 | 11.1 | 312 | 1816 | 1866
|
| ARNSBERGW.GE | 51.4 | 8.1 | 212 | 1817 | 1851
|
| ARNSBERGW.GE | 51.4 | 8.1 | 212 | 1817 | 1851
|
| BALTIMORE CU | 39.28 | -76.62 | 5 | 1817 | 2010
|
| BALTIMORE WS | 39.28 | -76.62 | 4 | 1817 | 1999
|
| CARLO FINLAN | 65.03 | 24.71 | 7 | 1817 | 2010
|
| CARLO FINLAN | 65 | 24.7 | -999 | 1817 | 1836
|
| HOHENFURTHAU | 48.6 | 15.3 | NA | 1817 | 1843
|
| HOHENFURTHAU | 48.6 | 15.3 | -999 | 1817 | 1843
|
| HOHENELBCZEC | 50.6 | 15.6 | NA | 1817 | 1850
|
| HOHENELBCZEC | 50.6 | 15.6 | -999 | 1817 | 1850
|
| LANDSKRON CZ | 49.9 | 16.6 | 1025 | 1817 | 1840
|
| LANDSKRON CZ | 49.9 | 16.6 | 1025 | 1817 | 1840
|
| SMETSCHNA CZ | 50.2 | 14 | 1077 | 1817 | 1847
|
| SMETSCHNA CZ | 50.2 | 14 | 1077 | 1817 | 1847
|
| SYKTYVKAR | 61.71 | 50.85 | 105 | 1817 | 2010
|
| SYKTYVKAR | 61.72 | 50.83 | 119 | 1817 | 2004
|
| KOBLENZ W.GE | 50.4 | 7.6 | 69 | 1818 | 1831
|
| KOBLENZ W.GE | 50.4 | 7.6 | 69 | 1818 | 1831
|
| MAASTRICHT-B | 50.92 | 5.78 | 115 | 1818 | 2010
|
| MAASTRICHT A | 50.92 | 5.78 | 116 | 1818 | 2010
|
| MUNSTER W.GE | 52 | 7.6 | 64 | 1818 | 1868
|
| MUNSTER W.GE | 52 | 7.6 | 64 | 1818 | 1868
|
| SAINT BERNHA | 45.8 | 6.1 | 2070 | 1818 | 1868
|
| SAINT BERNHA | 45.8 | 6.1 | 2070 | 1818 | 1868
|
| ST. BERNARDS | 45.7 | 6.9 | 2460 | 1818 | 1985
|
| ST. BERNARDS | 45.7 | 6.9 | 2460 | 1818 | 1985
|
| MINNEAPOLIS- | 44.88 | -93.22 | 256 | 1819 | 2010
|
| MINNEAPOLIS/ | 44.88 | -93.22 | 255 | 1819 | 2006
|
| SAMSUN | 41.28 | 36.33 | 4 | 1819 | 2010
|
| BOCHUMW.GERM | 51.5 | 7.2 | NA | 1820 | 1851
|
| BOCHUMW.GERM | 51.5 | 7.2 | -999 | 1820 | 1851
|
| BRESCIA/GHED | 45.42 | 10.28 | 97 | 1820 | 2010
|
| BRESCIA/GHED | 45.42 | 10.28 | 97 | 1820 | 2010
|
| CHAPEL HILL | 35.91 | -79.08 | 152 | 1820 | 2010
|
| CHAPEL HILL | 35.92 | -79.1 | 152 | 1820 | 2006
|
| FORT SNILLIN | 44.9 | -93.2 | 245 | 1820 | 1982
|
| HALLE E.GERM | 51.5 | 11.9 | 111 | 1820 | 1868
|
| HALLE E.GERM | 51.5 | 11.9 | 111 | 1820 | 1868
|
| IRKUTSK OBSE | 52.27 | 104.34 | 475 | 1820 | 2010
|
| IRKUTSK | 52.27 | 104.32 | 469 | 1820 | 2010
|
| PORTLAND INT | 43.65 | -70.31 | 16 | 1820 | 2010
|
| PORTLAND/INT | 43.65 | -70.32 | 19 | 1820 | 2006
|
| SOVETSK USSR | 55.1 | 21.8 | 37 | 1820 | 1930
|
| SOVETSK USSR | 55.1 | 21.8 | 37 | 1820 | 1930
|
| WASHINGTON D | 38.85 | -77.03 | 12 | 1820 | 2010
|
| WASHINGTON/N | 38.85 | -77.03 | 20 | 1820 | 2010
|
| NEW YORK CEN | 40.78 | -73.97 | 42 | 1821 | 2010
|
| NEW YORK CEN | 40.78 | -73.97 | 39 | 1821 | 2006
|
| ODESSA GMO | 46.47 | 30.67 | 51 | 1821 | 2010
|
| ODESA | 46.43 | 30.77 | 42 | 1821 | 2010
|
| SIMFEROPOLUS | 45.02 | 33.98 | 214 | 1821 | 2010
|
| SIMFEROPOLUS | 45 | 34 | 205 | 1821 | 2010
|
| BATON ROUGE | 30.52 | -91.15 | 18 | 1822 | 2010
|
| BATON ROUGE | 30.53 | -91.13 | 19 | 1822 | 2006
|
| EASTPORT ME. | 44.91 | -66.99 | 24 | 1822 | 2010
|
| EASTPORT ME | 44.92 | -67 | 23 | 1822 | 2006
|
| NEW YORK AVE | 40.63 | -73.96 | 7 | 1822 | 2009
|
| PRAIRIE DU C | 43.03 | -91.15 | 200 | 1822 | 2010
|
| PRAIRIE DU C | 43.03 | -91.15 | 200 | 1822 | 2006
|
| SOUTHPORT 5 | 33.99 | -78.01 | 6 | 1822 | 2010
|
| SOUTHPORT 5N | 34 | -78.02 | 6 | 1822 | 2006
|
| ARNSTADTE.GE | 50.8 | 11.3 | 898 | 1823 | 1867
|
| ARNSTADTE.GE | 50.8 | 11.3 | 898 | 1823 | 1867
|
| CHARLESTON I | 32.83 | -79.97 | 8 | 1823 | 2010
|
| CHARLESTON | 32.9 | -80 | 15 | 1823 | 2009
|
| CHARLESTON C | 32.78 | -79.93 | 3 | 1823 | 2006
|
| KOTHENE.GERM | 51.8 | 11.9 | NA | 1823 | 1847
|
| KOTHENE.GERM | 51.8 | 11.9 | -999 | 1823 | 1847
|
| KREUZBURG SW | 60 | 18.2 | 621 | 1823 | 1849
|
| KREUZBURG SW | 60 | 18.2 | 621 | 1823 | 1849
|
| MITAU USSR | 56.7 | 23.7 | 10 | 1823 | 1872
|
| MITAU USSR | 56.7 | 23.7 | 10 | 1823 | 1872
|
| NEURODE CZEC | 50.5 | 16.5 | 237 | 1823 | 1843
|
| NYSAPOLAND | 50.3 | 17.3 | 581 | 1823 | 1851
|
| NYSAPOLAND | 50.3 | 17.3 | 581 | 1823 | 1851
|
| PRINCESS ANN | 38.26 | -75.66 | 6 | 1823 | 2010
|
| PRINCESS ANN | 38.22 | -75.68 | 6 | 1823 | 2002
|
| STYKKISHOLMU | 65.08 | -22.72 | 10 | 1823 | 2010
|
| FELLINUSSR | 58.4 | 25.6 | 61 | 1824 | 1847
|
| FELLINUSSR | 58.4 | 25.6 | 61 | 1824 | 1847
|
| L'VOV | 49.82 | 23.95 | 325 | 1824 | 2010
|
| L'VIV | 49.82 | 23.95 | 323 | 1824 | 2010
|
| POLTAVA | 49.6 | 34.56 | 160 | 1824 | 2010
|
| POLTAVA | 49.6 | 34.55 | 160 | 1824 | 2010
|
| PORTSMOUTH S | 38.75 | -82.88 | 164 | 1824 | 2010
|
| PORTSMOUTH-S | 38.75 | -82.88 | 164 | 1824 | 2006
|
| SSEVASTOPOL | 44.6 | 33.5 | 40 | 1824 | 1875
|
| SSEVASTOPOL | 44.6 | 33.5 | 40 | 1824 | 1875
|
| WEST POINT | 41.38 | -73.97 | 97 | 1824 | 2006
|
| BRAUNSCHWEIG | 52.3 | 10.45 | 84 | 1825 | 2010
|
| BRAUNSCHWEIG | 52.3 | 10.45 | 88 | 1825 | 2010
|
| KISINEV U.S. | 47.02 | 28.93 | 124 | 1825 | 2010
|
| KISINEV | 47.02 | 28.98 | 173 | 1825 | 2010
|
| KRAKOW/BALIC | 50.08 | 19.8 | 234 | 1825 | 2010
|
| KRAKOW | 50.08 | 19.8 | 237 | 1825 | 2010
|
| MACDILL AFB/ | 27.85 | -82.52 | 6 | 1825 | 2010
|
| METZ/FRESCAT | 49.08 | 6.13 | 192 | 1825 | 2010
|
| METZ/FRESCAT | 49.08 | 6.13 | 191 | 1825 | 1868
|
| NEURODE CZEC | 50.5 | 16.5 | 237 | 1825 | 1843
|
| SINGAPORE SI | 1.34 | 103.93 | 17 | 1825 | 2010
|
| SINGAPORE SI | 1.3 | 103.9 | 18 | 1825 | 1984
|
| TAMPA INTERN | 27.97 | -82.53 | 5 | 1825 | 2010
|
| TAMPA/INT. F | 27.97 | -82.53 | 3 | 1825 | 2010
|
| WEST POINT | 41.38 | -73.96 | 98 | 1825 | 2010
|
| BERNSWITZERL | 47 | 7.4 | NA | 1826 | 1849
|
| BERNSWITZERL | 47 | 7.4 | -999 | 1826 | 1851
|
| UTICA HARBOR | 43.11 | -75.23 | 142 | 1826 | 1991
|
| UTICA | 43.08 | -75.2 | 176 | 1826 | 1991
|
| AUBURN | 42.92 | -76.54 | 235 | 1827 | 2010
|
| AUBURN | 42.92 | -76.53 | 234 | 1827 | 2006
|
| ITHACA CORNE | 42.46 | -76.46 | 292 | 1827 | 2010
|
| ITHACA | 44.5 | -76.8 | 293 | 1827 | 1990
|
| ITHACA CORNE | 42.45 | -76.45 | 292 | 1827 | 2006
|
| KIRKWALL | 59 | -2.9 | 26 | 1827 | 2009
|
| LOWVILLE | 43.8 | -75.48 | 262 | 1827 | 2010
|
| LOWVILLE | 43.8 | -75.48 | 262 | 1827 | 2006
|
| MONTPELLIERF | 43.58 | 3.95 | 25 | 1827 | 2010
|
| MONTPELLIER | 43.58 | 3.97 | 6 | 1827 | 2010
|
| ORKNEYUK | 59.1 | -3.3 | 22 | 1827 | 1906
|
| ORKNEYUK | 59.1 | -3.3 | 22 | 1827 | 1906
|
| BURLINGTON I | 44.47 | -73.15 | 102 | 1828 | 2010
|
| BURLINGTON/I | 44.47 | -73.15 | 104 | 1828 | 2006
|
| DEUTSCHBROD | 49.6 | 15.6 | 1238 | 1828 | 1866
|
| DEUTSCHBROD | 49.6 | 15.6 | 1238 | 1828 | 1866
|
| DORPATUSSR | 58.4 | 24.5 | 10 | 1828 | 1875
|
| DORPATUSSR | 58.4 | 24.5 | 10 | 1828 | 1875
|
| OXFORDUK | 51.7 | -1.2 | 63 | 1828 | 1980
|
| OXFORDUK | 51.7 | -1.2 | 63 | 1828 | 1980
|
| POUGHKEEPSIE | 41.64 | -73.9 | 46 | 1828 | 2010
|
| POUGHKEEPSIE | 41.63 | -73.92 | 51 | 1828 | 2006
|
| SITKA MAGNET | 57.06 | -135.35 | 16 | 1828 | 2010
|
| SITKA | 57.07 | -135.35 | 20 | 1828 | 1993
|
| STRALSUND E. | 54.3 | 13.1 | NA | 1828 | 1852
|
| STRALSUND E. | 54.3 | 13.1 | -999 | 1828 | 1852
|
| TETSCHENCZEC | 50.8 | 14.2 | 288 | 1828 | 1842
|
| TETSCHENCZEC | 50.8 | 14.2 | 288 | 1828 | 1842
|
| AACHEN | 50.78 | 6.1 | 195 | 1829 | 2010
|
| AACHEN | 50.78 | 6.1 | 205 | 1829 | 2010
|
| BREMEN GERMA | 53.05 | 8.8 | 4 | 1829 | 2010
|
| BREMEN | 53.05 | 8.8 | 5 | 1829 | 2010
|
| ELBLAG POLAN | 54.17 | 19.42 | 43 | 1829 | 2010
|
| ELBLAG | 54.17 | 19.43 | 43 | 1829 | 2010
|
| FREDONIA | 42.45 | -79.27 | 231 | 1829 | 2009
|
| FREDONIA | 42.45 | -79.3 | 231 | 1829 | 2006
|
| Helsinki/Kai | 60.2 | 25 | 4 | 1829 | 2000
|
| HELSINKI/SEU | 60.3 | 25 | 56 | 1829 | 2010
|
| HELSINKI/SEU | 60.3 | 25 | 58 | 1829 | 2010
|
| HOULTON 5 N | 46.18 | -67.83 | 121 | 1829 | 2010
|
| HOULTON 5N | 46.2 | -67.83 | 118 | 1829 | 2006
|
| JAKUTSK | 62.02 | 129.72 | 101 | 1829 | 2010
|
| PENN YAN 8 W | 42.67 | -77.18 | 304 | 1829 | 1994
|
| PENN YAN 8W | 42.67 | -77.18 | 303 | 1829 | 1994
|
| TROY LOCK AN | 42.75 | -73.68 | 7 | 1829 | 2010
|
| TROY LOCKDAM | 42.75 | -73.68 | 7 | 1829 | 2006
|
| VARDOE | 70.37 | 31.1 | 15 | 1829 | 2010
|
| VARDO | 70.37 | 31.1 | 15 | 1829 | 2010
|
| WILTENAUSTRI | 47.3 | 11.4 | 184 | 1829 | 1858
|
| WILTENAUSTRI | 47.3 | 11.4 | 184 | 1829 | 1858
|
| YAKUTSK GMO | 62.06 | 129.74 | 100 | 1829 | 2010
|
| ARYSPOLAND | 53.8 | 22.1 | 450 | 1830 | 1865
|
| ARYSPOLAND | 53.8 | 22.1 | 450 | 1830 | 1865
|
| DARMSTADT W. | 49.9 | 8.7 | 157 | 1830 | 1930
|
| DARMSTADT W. | 49.9 | 8.7 | 157 | 1830 | 1930
|
| KARESUANDO A | 68.45 | 22.48 | 328 | 1830 | 2010
|
| KARESUANDO | 68.45 | 22.5 | 327 | 1830 | 2010
|
| KEY WEST BOC | 24.56 | -81.75 | 6 | 1830 | 2010
|
| KEY WEST/INT | 24.55 | -81.75 | 6 | 1830 | 2006
|
| LEAVENWORTH | 39.3 | -94.91 | 268 | 1830 | 2010
|
| LEAVENWORTH | 39.32 | -94.93 | 277 | 1830 | 2006
|
| ROCHESTER GR | 43.14 | -77.67 | 150 | 1830 | 2010
|
| ROCHESTER AI | 43.13 | -77.67 | 182 | 1830 | 2006
|
| SYLTE.GERMAN | 54.1 | 12.7 | 650 | 1830 | 1863
|
| SYLTE.GERMAN | 54.1 | 12.7 | 650 | 1830 | 1863
|
| BLUE HILL OB | 42.22 | -71.12 | 195 | 1831 | 2006
|
| BUFFALO GREA | 42.94 | -78.73 | 215 | 1831 | 2010
|
| BUFFALO/GREA | 42.93 | -78.73 | 215 | 1831 | 2006
|
| DUBLIN-PHOEN | 53.4 | -6.29 | 77 | 1831 | 2010
|
| DUBLIN AIRPO | 53.43 | -6.25 | 85 | 1831 | 2010
|
| PROVIDENCE T | 41.77 | -71.43 | 18 | 1831 | 2010
|
| PROVIDENCE W | 41.73 | -71.43 | 15 | 1831 | 2006
|
| SVERDLOVSKUS | 56.83 | 60.61 | 260 | 1831 | 2010
|
| SVERDLOVSKUS | 56.8 | 60.6 | 237 | 1831 | 2004
|
| FLORENCEITAL | 43.8 | 11.22 | 47 | 1832 | 2010
|
| FLORENCEITAL | 43.8 | 11.3 | 75 | 1832 | 1981
|
| OCALA TAYLOR | 29.17 | -82.09 | 22 | 1832 | 2010
|
| OCALA | 29.2 | -82.08 | 22 | 1832 | 2006
|
| ORENBURG/CHK | 51.74 | 55.1 | 112 | 1832 | 2010
|
| ORENBURG | 51.68 | 55.1 | 117 | 1832 | 2004
|
| ROSTOCK E.GE | 54.1 | 12.2 | NA | 1832 | 1868
|
| ROSTOCK E.GE | 54.1 | 12.2 | -999 | 1832 | 1868
|
| SAVANNAH CHA | 32.08 | -81.17 | 14 | 1832 | 2010
|
| SAVANNAH/MUN | 32.13 | -81.2 | 15 | 1832 | 2006
|
| TOBOLSK AS-2 | 58.15 | 68.24 | 47 | 1832 | 2010
|
| TOBOL'SK | 58.15 | 68.25 | 50 | 1832 | 2010
|
| ENISSALAUSSR | 44.9 | 34.6 | 460 | 1833 | 1872
|
| ENISSALAUSSR | 44.9 | 34.6 | 460 | 1833 | 1872
|
| KURSK U.S.S. | 51.72 | 36.18 | 215 | 1833 | 2010
|
| KURSK | 51.77 | 36.17 | 247 | 1833 | 1990
|
| STENNIS INTE | 30.33 | -89.44 | 6 | 1833 | 2010
|
| UCCLE | 50.8 | 4.36 | 104 | 1833 | 2010
|
| UCCLE | 50.8 | 4.35 | 104 | 1833 | 2010
|
| WAVELAND | 30.3 | -89.38 | 2 | 1833 | 2006
|
| BELFAST/ALDE | 54.65 | -6.21 | 72 | 1834 | 2010
|
| BELFAST/ALDE | 54.65 | -6.22 | 81 | 1834 | 2010
|
| HANOVER | 43.7 | -72.28 | 184 | 1834 | 2009
|
| HANOVER | 43.7 | -72.28 | 183 | 1834 | 2006
|
| ST.JOHN'S NF | 47.62 | -52.73 | 140 | 1834 | 1990
|
| ST.JOHN'S NF | 47.62 | -52.73 | 140 | 1834 | 1990
|
| BARCELONA SP | 41.4 | 2.2 | 95 | 1835 | 1985
|
| BARCELONA SP | 41.4 | 2.2 | 95 | 1835 | 1985
|
| GUETERSLOH | 51.93 | 8.34 | 73 | 1835 | 2010
|
| GUETERSLOH | 51.92 | 8.3 | 72 | 1835 | 1920
|
| HANOVER | 43.7 | -72.3 | 183 | 1835 | 1990
|
| NEW-YORK-CEN | 40.8 | -74 | 39 | 1835 | 1990
|
| NOVGOROD | 58.52 | 31.26 | 24 | 1835 | 1991
|
| NOVGOROD | 58.52 | 31.25 | 24 | 1835 | 1993
|
| WEST-POINT | 41.4 | -74 | 97 | 1835 | 1990
|
| AMHERST | 42.38 | -72.53 | 45 | 1836 | 2010
|
| AMHERST | 42.4 | -72.5 | 45 | 1836 | 1990
|
| AMHERST | 42.38 | -72.53 | 45 | 1836 | 2006
|
| GOERLITZ | 51.17 | 14.95 | 238 | 1836 | 2010
|
| GORLITZGERMA | 51.17 | 14.95 | 237 | 1836 | 2010
|
| HILLSBORO | 39.2 | -83.62 | 335 | 1836 | 2010
|
| HILLSBORO | 39.2 | -83.62 | 335 | 1836 | 2006
|
| PERPIGNAN | 42.73 | 2.88 | 46 | 1836 | 2010
|
| PERPIGNAN | 42.73 | 2.87 | 48 | 1836 | 2010
|
| SARATOV | 51.57 | 46.03 | 149 | 1836 | 2010
|
| SARATOV | 51.57 | 46.03 | 156 | 1836 | 2004
|
| ST LOUIS LAM | 38.75 | -90.38 | 180 | 1836 | 2010
|
| ST.LOUIS/LAM | 38.75 | -90.37 | 172 | 1836 | 2010
|
| SZCZECIN-DAB | 53.4 | 14.61 | 4 | 1836 | 2010
|
| SZCZECIN | 53.4 | 14.62 | 3 | 1836 | 2010
|
| ZURICH/TOWN/ | 47.38 | 8.58 | 565 | 1836 | 2010
|
| ZURICH (TOWN | 47.38 | 8.57 | 569 | 1836 | 2010
|
| ASTRAKHAN' | 46.28 | 48.04 | -14 | 1837 | 2010
|
| ASTRAHAN' | 46.28 | 48.05 | -23 | 1837 | 2010
|
| CHARLOTTESVI | 38.03 | -78.52 | 235 | 1837 | 2010
|
| CHARLOTTESVI | 38.03 | -78.52 | 265 | 1837 | 2006
|
| GARDINER | 44.22 | -69.78 | 43 | 1837 | 2009
|
| GARDINER | 44.22 | -69.78 | 42 | 1837 | 2006
|
| Graz-Univers | 47.1 | 15.5 | 366 | 1837 | 2001
|
| LUGAN USSR | 48.6 | 39.3 | 60 | 1837 | 1880
|
| LUGAN USSR | 48.6 | 39.3 | 60 | 1837 | 1880
|
| TOMSK | 56.5 | 84.92 | 139 | 1837 | 1990
|
| THIRUVANANTH | 8.48 | 76.95 | 64 | 1837 | 2010
|
| TRIVANDRUMOB | 8.48 | 76.95 | 54 | 1837 | 2010
|
| USSOLJE USSR | 59.3 | 56.8 | 107 | 1837 | 1853
|
| USSOLJE USSR | 59.3 | 56.8 | 107 | 1837 | 1853
|
| ZLATOUST | 55.17 | 59.67 | 551 | 1837 | 1993
|
| ZLATOUST | 55.2 | 59.67 | 538 | 1837 | 1875
|
| BARNAUL | 53.37 | 83.61 | 179 | 1838 | 2010
|
| BARNAUL | 53.43 | 83.52 | 184 | 1838 | 2004
|
| BOGOSLOWSKUS | 59.8 | 60.1 | 190 | 1838 | 1880
|
| BOGOSLOWSKUS | 59.8 | 60.1 | 190 | 1838 | 1880
|
| MARSEILLE/MA | 43.44 | 5.26 | 14 | 1838 | 2010
|
| MARSEILLE/MA | 43.3 | 5.4 | 8 | 1838 | 2010
|
| OGDENSBURG 4 | 44.73 | -75.44 | 85 | 1838 | 2010
|
| OGDENSBURG 4 | 44.73 | -75.43 | 85 | 1838 | 2006
|
| SCHOSSL CZEC | 50.5 | 13.5 | NA | 1838 | 1865
|
| SCHOSSL CZEC | 50.5 | 13.5 | -999 | 1838 | 1865
|
| SSAREPTAUSSR | 48.5 | 44.6 | 50 | 1838 | 1855
|
| SSAREPTAUSSR | 48.5 | 44.6 | 50 | 1838 | 1855
|
| BALTISCHPORT | 59.4 | 24.1 | 10 | 1839 | 1880
|
| BALTISCHPORT | 59.4 | 24.1 | 10 | 1839 | 1880
|
| DETROIT MICH | 42.41 | -83.01 | 191 | 1839 | 2010
|
| DETROIT MICH | 42.4 | -83 | 191 | 1839 | 2010
|
| EISENHOWER N | 39.83 | -77.24 | 163 | 1839 | 2010
|
| EISENHOWER N | 39.8 | -77.27 | 158 | 1839 | 2006
|
| ISTANBUL/GOZ | 40.97 | 29.09 | 36 | 1839 | 2010
|
| ISTANBUL/GOZ | 40.97 | 29.08 | 33 | 1839 | 2010
|
| NERCHINSKIJ | 51.32 | 119.62 | 620 | 1839 | 2010
|
| NERCINSKIJ Z | 51.32 | 119.62 | 619 | 1839 | 2010
|
| NIZHNYJ TAGI | 57.88 | 60.08 | 258 | 1839 | 2010
|
| NIZHNYJ TAGI | 57.88 | 60.07 | 260 | 1839 | 1865
|
| PLATTSBURGH | 44.65 | -73.47 | 60 | 1839 | 2010
|
| PLATTSBURGH | 44.65 | -73.47 | 50 | 1839 | 1995
|
| ST PAUL ISLA | 57.16 | -170.22 | 8 | 1839 | 2010
|
| ST. PAUL | 57.15 | -170.22 | 9 | 1839 | 2010
|
| STANISLAV RU | 45.9 | 24.8 | 205 | 1839 | 1854
|
| STANISLAV RU | 45.9 | 24.8 | 205 | 1839 | 1854
|
| TOMSK | 56.46 | 84.95 | 134 | 1839 | 2010
|
| URALSK KAZA | 51.25 | 51.33 | 35 | 1839 | 2010
|
| URALSK | 51.25 | 51.28 | 37 | 1839 | 2010
|
| BANGKOK METR | 13.73 | 100.55 | 11 | 1840 | 2010
|
| BANGKOK | 13.73 | 100.57 | 20 | 1840 | 2010
|
| FORT PIERCE | 27.47 | -80.35 | 7 | 1840 | 2010
|
| FORT PIERCE | 27.47 | -80.35 | 7 | 1840 | 2006
|
| HARRISBURG C | 40.22 | -76.85 | 105 | 1840 | 2010
|
| HARRISBURG C | 40.22 | -76.85 | 103 | 1840 | 1991
|
| LUEBECK-BLAN | 53.82 | 10.7 | 15 | 1840 | 1868
|
| LUEBECK-BLAN | 53.82 | 10.7 | 15 | 1840 | 1868
|
| MADRID/RETIR | 40.4 | -3.7 | 660 | 1840 | 2009
|
| MADRID/RETIR | 40.4 | -3.7 | 657 | 1840 | 1991
|
| TORONTO CANA | 43.67 | -79.4 | 113 | 1840 | 2010
|
| TORONTO ON | 43.67 | -79.4 | 112 | 1840 | 1990
|
| BEIJING | 39.9 | 116.33 | 50 | 1841 | 2010
|
| BEIJING | 39.93 | 116.28 | 55 | 1841 | 2010
|
| HOBART REGIO | -42.85 | 147.42 | 29 | 1841 | 2010
|
| HOBART AIRPO | -42.83 | 147.48 | 27 | 1841 | 2010
|
| NANCY/ESSEY | 48.68 | 6.21 | 215 | 1841 | 2002
|
| NANCY/ESSEY | 48.68 | 6.22 | 217 | 1841 | 2002
|
| TRIESTE | 45.65 | 13.77 | 15 | 1841 | 2010
|
| TRIESTE | 45.65 | 13.75 | 20 | 1841 | 2010
|
| BALACHNAUSSR | 56.5 | 43.6 | 60 | 1842 | 1875
|
| BALACHNAUSSR | 56.5 | 43.6 | 60 | 1842 | 1875
|
| BOMBAY/COLAB | 18.9 | 72.81 | 11 | 1842 | 2010
|
| BOMBAY / COL | 18.9 | 72.82 | 11 | 1842 | 2010
|
| BORDEAUX/MER | 44.83 | -0.7 | 53 | 1842 | 2010
|
| BORDEAUX/MER | 44.83 | -0.7 | 61 | 1842 | 2010
|
| SALZBURG-FLU | 47.8 | 13 | 439 | 1842 | 2010
|
| BEYROUTH /AE | 33.84 | 35.49 | 20 | 1843 | 2003
|
| BEYROUTH (AE | 33.82 | 35.48 | 19 | 1843 | 1987
|
| FORT SCOTT | 37.86 | -94.71 | 258 | 1843 | 2010
|
| FORT SCOTT | 37.85 | -94.7 | 257 | 1843 | 2006
|
| IZMIR TURKEY | 38.4 | 27.3 | 25 | 1843 | 1991
|
| IZMIR TURKEY | 38.4 | 27.3 | 25 | 1843 | 1991
|
| SYRACUSE HAN | 43.11 | -76.11 | 125 | 1843 | 2010
|
| SYRACUSE/HAN | 43.12 | -76.12 | 124 | 1843 | 2006
|
| WEST CHESTER | 39.97 | -75.63 | 137 | 1843 | 2006
|
| EMDEN_FLUGPL | 53.35 | 7.2 | 4 | 1844 | 2004
|
| EMDEN-HAFEN | 53.3 | 7.2 | 6 | 1844 | 1997
|
| KRONSTADT US | 60 | 29.8 | 20 | 1844 | 1875
|
| KRONSTADT US | 60 | 29.8 | 20 | 1844 | 1875
|
| OSWEGO EAST | 43.47 | -76.5 | 107 | 1844 | 2009
|
| OSWEGO EAST | 43.47 | -76.5 | 106 | 1844 | 2006
|
| TBILISY GMO | 41.68 | 44.91 | 452 | 1844 | 2010
|
| TBILISI | 41.68 | 44.95 | 490 | 1844 | 1994
|
| CAYENNE/ROCH | 4.83 | -52.37 | 9 | 1845 | 2010
|
| CAYENNE/ROCH | 4.83 | -52.37 | 9 | 1845 | 2010
|
| DIJON | 47.27 | 5.09 | 226 | 1845 | 2010
|
| DIJON | 47.27 | 5.08 | 227 | 1845 | 2010
|
| KIROV (VYATK | 58.62 | 49.56 | 159 | 1845 | 2010
|
| KIROV | 58.52 | 49.32 | 146 | 1845 | 1994
|
| NAGASAKI | 32.73 | 129.88 | 32 | 1845 | 2010
|
| NAGASAKI | 32.73 | 129.87 | 35 | 1845 | 2010
|
| ROUEN/BOOS F | 49.38 | 1.19 | 156 | 1845 | 2010
|
| ROUEN | 49.38 | 1.18 | 157 | 1845 | 2010
|
| TAMBOV U.S.S | 52.76 | 41.41 | 139 | 1845 | 2010
|
| TAMBOV | 52.8 | 41.33 | 128 | 1845 | 1990
|
| GEORGETOWN | 6.8 | -58.15 | 2 | 1846 | 2009
|
| GEORGETOWN | 6.8 | -58.15 | 2 | 1846 | 2007
|
| SAN ANTONIO/ | 29.53 | -98.47 | 242 | 1846 | 2006
|
| STYKKISHOLMU | 65.08 | -22.73 | 8 | 1846 | 2010
|
| DURHAMUK | 54.8 | -1.6 | 102 | 1847 | 1981
|
| DURHAMUK | 54.8 | -1.6 | 102 | 1847 | 1981
|
| SAN FRANCISC | 37.62 | -122.38 | 5 | 1847 | 2010
|
| SHANGHAICHIN | 31.26 | 121.43 | 5 | 1847 | 2010
|
| SHANGHAICHIN | 31.2 | 121.4 | 7 | 1847 | 2010
|
| BAKU (DENDRO | 40.42 | 49.78 | 61 | 1848 | 1875
|
| BAKU (DENDRO | 40.42 | 49.78 | 61 | 1848 | 1875
|
| DARJEELING I | 27.05 | 88.29 | 2128 | 1848 | 1997
|
| DARJEELING | 27.05 | 88.27 | 2128 | 1848 | 1999
|
| ERFURT/BINDE | 50.98 | 10.97 | 320 | 1848 | 2010
|
| ERFURT-BINDE | 50.98 | 10.97 | 322 | 1848 | 2010
|
| FORT SHEVTCH | 44.55 | 50.23 | -14 | 1848 | 2010
|
| FORT SEVCENK | 44.55 | 50.25 | -25 | 1848 | 2009
|
| FRANKFURT AM | 52.3 | 14.6 | 48 | 1848 | 1868
|
| FRANKFURT AM | 52.3 | 14.6 | 48 | 1848 | 1868
|
| HAMMERFESTNO | 70.7 | 23.7 | NA | 1848 | 1863
|
| HAMMERFESTNO | 70.7 | 23.7 | -999 | 1848 | 1863
|
| KALININGRAD | 54.72 | 20.58 | 22 | 1848 | 2010
|
| KALININGRAD | 54.72 | 20.55 | 21 | 1848 | 1993
|
| KOLNW.GERMAN | 51 | 7 | 45 | 1848 | 1858
|
| KOLNW.GERMAN | 51 | 7 | 45 | 1848 | 1858
|
| KOSZALIN POL | 54.2 | 16.17 | 34 | 1848 | 2010
|
| KOSZALIN | 54.2 | 16.15 | 34 | 1848 | 1989
|
| LOCKPORT 2 S | 43.15 | -78.67 | 177 | 1848 | 1999
|
| LOCKPORT 2NE | 43.18 | -78.65 | 158 | 1848 | 1999
|
| OBIRAUSTRIA | 46.5 | 14.5 | 2044 | 1848 | 1944
|
| OBIRAUSTRIA | 46.5 | 14.5 | 2044 | 1848 | 1944
|
| STONYHURSTUK | 53.8 | -2.5 | 115 | 1848 | 1969
|
| STONYHURSTUK | 53.8 | -2.5 | 115 | 1848 | 1969
|
| TORGAUE.GERM | 51.6 | 13 | 80 | 1848 | 1868
|
| TORGAUE.GERM | 51.6 | 13 | 80 | 1848 | 1868
|
| EAGLE PASS 3 | 28.72 | -100.49 | 247 | 1849 | 2010
|
| EAGLE PASS | 28.7 | -100.48 | 245 | 1849 | 2006
|
| KIEL HOLTENA | 54.37 | 10.14 | 31 | 1849 | 2010
|
| KIEL-HOLTENA | 54.38 | 10.15 | 31 | 1849 | 1926
|
| LUNGI | 8.62 | -13.2 | 27 | 1849 | 2010
|
| LUNGI | 8.62 | -13.2 | 27 | 1849 | 1998
|
| RIO GRANDE C | 26.38 | -98.84 | 53 | 1849 | 2010
|
| RIO GRANDE C | 26.38 | -98.87 | 53 | 1849 | 2006
|
| SAN ANTONIO | 29.46 | -98.47 | 222 | 1849 | 2010
|
| SAN DIEGO LI | 32.73 | -117.17 | 6 | 1849 | 2010
|
| SANTIAGO/COM | 42.87 | -8.31 | 367 | 1849 | 2010
|
| SAN DIEGO/LI | 32.73 | -117.17 | 9 | 1849 | 2010
|
| SANTIAGO/COM | 42.8 | -8.1 | -999 | 1849 | 2010
|
| SATA FE COUN | 35.64 | -106.03 | 2039 | 1849 | 2010
|
| SOCORRO | 34.08 | -106.88 | 1397 | 1849 | 2009
|
| SOCORRO | 34.08 | -106.88 | 1397 | 1849 | 2006
|
| VANCOUVER 4 | 45.68 | -122.65 | 64 | 1849 | 2010
|
| VANCOUVER 4N | 45.68 | -122.65 | 64 | 1849 | 2006
|
|


