The GISS V4 land/ocean temperature anomaly rose by 0.11°C from November to December 2019 (1.0 to 1.11°C). That compared with a 0.083deg;C rise in the TempLS V4 mesh index (now 0.093°C with later data). AS with TempLS, it was the second warmest December in the GISS record, only 0.05°C lower than 2015.
That completes the data for 2019, and you can read the joint NOAA/GISS presentation here. Their results were in close agreement, and both agreed with TempLS that it was the second warmest year after 2016, and not far behind. GISS and NOAA both said it was 0.04°C behind. TempLS put the difference at 0.034deg;C.
RealClimate has a post here.
The overall pattern was similar to that in TempLS, as shown below.
As usual here, I will compare the GISS and earlier TempLS plots below the jump.
Thursday, January 16, 2020
Friday, January 10, 2020
A trap with bushfire area statistics in Australia
While discussing the current very bad bushfires in Australia, I have been getting into comparisons with the areas burnt in previous years. This year is very large - currently often quoted as about 10.7 Million hectares. That is huge relative to some previous bad years - eg 1939 at 2 M ha. But I sometimes encounter claims of other monster fires in the past. One is the bogus 5 M ha attributed to the 1851 fires in Victoria. But another one I encountered was the claim of 117 M Ha in 1974/5 at Roy Spencer's blog. These do seem to dwarf the present fires.
Now I had encountered this year in fire statistics before. 1974 was a very wet winter in much of Australia, and in the following December, there were large fires in western NSW, an arid region, where the unusual winter growth burned vigorously. There is a contemporary account here. The area was quite large, 4.5 M ha has been quoted, and homes were lost and six people killed. So I thought that was what is meant.
But Roy Spencer quoted over 100 M Ha. The total area of NSW is 81 M ha. California and Texas together are about 108 M ha. I didn't believe it. But he had a plot of Wiki data:
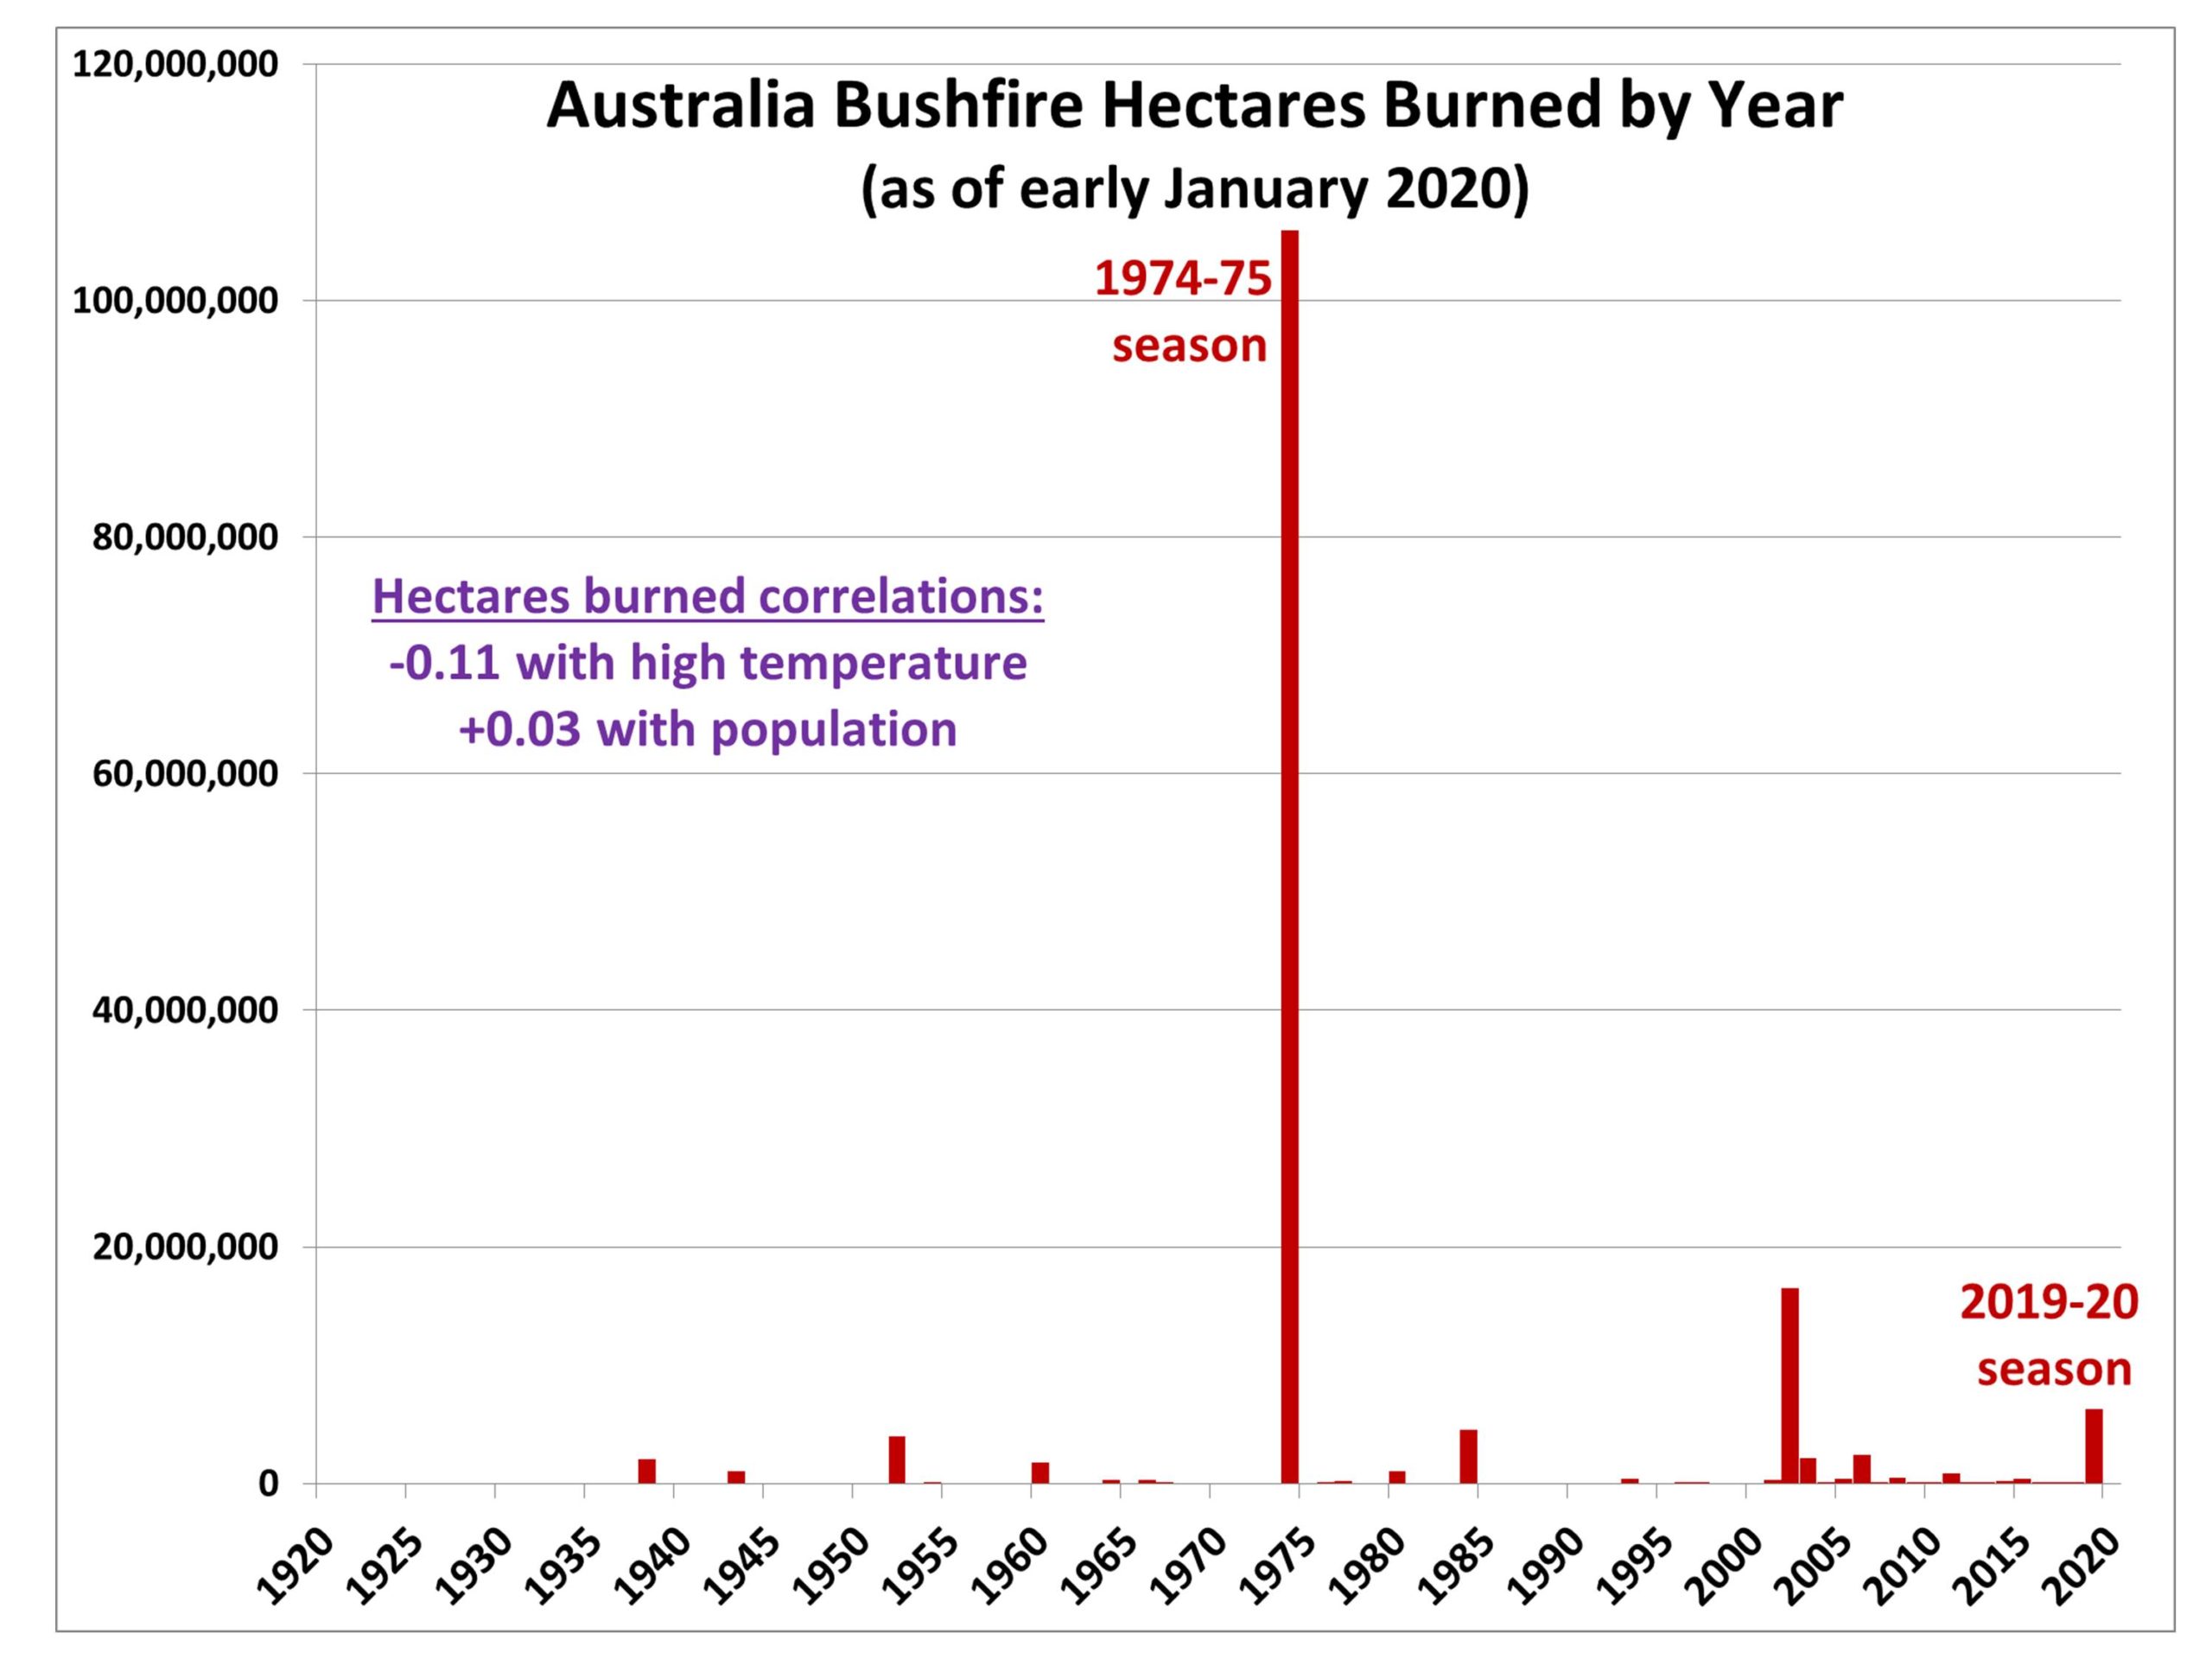
and indeed the table did list numbers like 45 M ha for the Northern Territory in that year, total 117 M ha. Now I remember the NSW fires, but I didn't remember any stories about such a huge conflagration, which as they noted, is about 15% of the country.
One source quoted was this report to the Government following the 2003 fires (a sort of poor man's Royal Commission). I was at this stage being harried by commenter harry at WUWT, who helpfully pointed to this document, which was part of the Commonwealth Yearbook for 1995 (ABS). Now I am not a fan of these government stats sources for this sort of data, since I don't think they do much scholarly inquiry, but just take figures at face value. But this was marked as contributed by Phil Cheney of CSIRO, who I used to know by reputation, who was a doughty warrior for prescribed burning. So there should be something to it.
"harry" then pointed me to this informative document about NT and in particular its savanna fires. I knew these were regular and large, but I did not realise how large, or at least how large were the quoted areas. It did say that 45 M ha were burnt in 1974. But it also gave this table of particularly large fire years:

So 1974 was large, but not exceptional. That is why I hadn't heard of it. But now there is a curiosity. The 45 M ha for 1969 would also easily qualify for the Wiki list of big fires, as would the other years. But as Roy's graph shows, 1974 stands alone.
I think this probably does come back to Phil Cheney's doc, and indicates the haphazard way these numbers are collected. I think Phil was just using 1974 to illustrate how the northern savanna burnings were large but different to the forest burnings. But it is a number, and so it goes into collections like Wiki's. He didn't mention 1969, so it doesn't.
I looked up more references on savanna regions. This paper gives some general averages:
And there is the dilemma. These numbers would dwarf most years of temperate forest burning. But that is what we want to know about, so they must be separated. This is not being done systematically. In particular, there is the random inclusion of savanna data for 1974/5 in the Wiki list.
Wiki gives 10.7 M ha as the area burnt by the current season's fires. That does not seem to include savanna, but one has to be vigilant, and a further complication is that some of the forest fires have been close to the tropic in Qld (even Mareeba is mentioned).
Anyway, I think the message for the moment is to be aware of the distinction between temperate forest fires and the fires of the savanna, and also the occasional flare-ups in the arid regions, which are really something different. I hope Wiki will wake up to this too.
Now I had encountered this year in fire statistics before. 1974 was a very wet winter in much of Australia, and in the following December, there were large fires in western NSW, an arid region, where the unusual winter growth burned vigorously. There is a contemporary account here. The area was quite large, 4.5 M ha has been quoted, and homes were lost and six people killed. So I thought that was what is meant.
But Roy Spencer quoted over 100 M Ha. The total area of NSW is 81 M ha. California and Texas together are about 108 M ha. I didn't believe it. But he had a plot of Wiki data:
and indeed the table did list numbers like 45 M ha for the Northern Territory in that year, total 117 M ha. Now I remember the NSW fires, but I didn't remember any stories about such a huge conflagration, which as they noted, is about 15% of the country.
One source quoted was this report to the Government following the 2003 fires (a sort of poor man's Royal Commission). I was at this stage being harried by commenter harry at WUWT, who helpfully pointed to this document, which was part of the Commonwealth Yearbook for 1995 (ABS). Now I am not a fan of these government stats sources for this sort of data, since I don't think they do much scholarly inquiry, but just take figures at face value. But this was marked as contributed by Phil Cheney of CSIRO, who I used to know by reputation, who was a doughty warrior for prescribed burning. So there should be something to it.
"harry" then pointed me to this informative document about NT and in particular its savanna fires. I knew these were regular and large, but I did not realise how large, or at least how large were the quoted areas. It did say that 45 M ha were burnt in 1974. But it also gave this table of particularly large fire years:
So 1974 was large, but not exceptional. That is why I hadn't heard of it. But now there is a curiosity. The 45 M ha for 1969 would also easily qualify for the Wiki list of big fires, as would the other years. But as Roy's graph shows, 1974 stands alone.
I think this probably does come back to Phil Cheney's doc, and indicates the haphazard way these numbers are collected. I think Phil was just using 1974 to illustrate how the northern savanna burnings were large but different to the forest burnings. But it is a number, and so it goes into collections like Wiki's. He didn't mention 1969, so it doesn't.
I looked up more references on savanna regions. This paper gives some general averages:
| State | Annual average area burnt M ha savanna |
| NT | 18.1 |
| WA | 10.6 |
| Qld | 8.56 |
And there is the dilemma. These numbers would dwarf most years of temperate forest burning. But that is what we want to know about, so they must be separated. This is not being done systematically. In particular, there is the random inclusion of savanna data for 1974/5 in the Wiki list.
Wiki gives 10.7 M ha as the area burnt by the current season's fires. That does not seem to include savanna, but one has to be vigilant, and a further complication is that some of the forest fires have been close to the tropic in Qld (even Mareeba is mentioned).
Anyway, I think the message for the moment is to be aware of the distinction between temperate forest fires and the fires of the savanna, and also the occasional flare-ups in the arid regions, which are really something different. I hope Wiki will wake up to this too.
Thursday, January 9, 2020
Murdoch's mendacious myth-building on bushfires and arson.
While arguing at Wattsupwiththat I started to encounter a run of claims that 183 people had been arrested for arson in connection with the ongoing bushfires in Australia. They cited this article in Murdoch's Australian, with the headline "Bushfires: Firebugs fuelling crisis as national arson arrest toll hits 183". So I read the article.
The headline seems immediately misleading. The story actually says
"NSW police data shows that since November 8, 24 people have been arrested for deliberately starting bushfires, while 184 people have been charged or cautioned for bushfire-related offences."
An earlier version had said
“183 people have been charged or cautioned for bushfire-related offences since November 8", which seems to be where the headline 183 came from. But "charged or cautioned for bushfire-related offences" is very different from being arrested for arson. Australia rightly has draconian laws on fire safety in hot weather, and many of these offences relate to home barbecues, dropping cigarette butts, or fireworks.
Quite a lot has now been written on this story. Ketan Joshi has an informative Twitter thread. Snopes refutes an Infowars version of the story. Sou at HotWhopper has a lot to say on the real causes of the bushfires, and on the widespread attempts to push the "it was arsonists" line.
There is another Twitter thread by Jason Wilson, in which he notes that the story was even pushed by Trump Jr.
The prompt for the articles was this statement by NSW Police. It says:
"Since Friday 8 November 2019, legal action – which ranges from cautions through to criminal charges – has been taken against 183 people – including 40 juveniles – for 205 bushfire-related offences.
Of note:
- 24 people have been charged over alleged deliberately-lit bushfires
- 53 people have had legal actions for allegedly failing to comply with a total fire ban, and
- 47 people have had legal actions for allegedly discarding a lighted cigarette or match on land."
Note that the Australian text is already inflating. They have (later) boosted the 183 to 184, and counted the "arson" charges separately to the 183. But there is, or seems to be, a subtlety missed in the discussion. The headline now says "Bushfires: Firebugs fuelling crisis as national arson arrest toll hits 183"
. The word "national" has been added. The original version, as shown in the screenshot by Joshi and preserved in the URL, did not have it. And indeed, the article does list a number of allegations in other states, although they add to 172, not 183.
At this point, I note that a very similar story appeared in the Trump-supporting Epoch Times, headed "Police Take Legal Action Against More Than 180 in Australia for Alleged Bushfire-Related Offenses"
But from the URL, the original headline was the familiar "nearly-200-people-arrested-in-australia-for-deliberately-lighting-bushfires". They appended a correction:
"Correction: A previous version of this article, in the headline, incorrectly stated the actions police took against 183 people for alleged bushfire-related offenses in Australia. Police have taken legal action against them. The Epoch Times regrets the error."
They do acknowledge that the original headline misrepresented the NSW Police report.
Not so the Australian. They just changed the headline to switch the basis of the claim from NSW to national, even though the arithmetic doesn't add up. So I looked a little further.
The Oz said
"Queensland police say 101 people have been picked up for setting fires in the bush, 32 adults and 69 juveniles.
In Tasmania, where fires have sprung up in the north of the state and outside Hobart, four were caught setting fire to vegetation. Victoria reported 43 charged for 2019."
I can't find out much more about the Qld figure, which would have to be more than half the national claim. "Setting fires in the bush" is not necessarily arson; it could be campfires, BBQs, farmers burning off. But I did dig into the Victorian figure.
I found it is based on the Crime Statistics Agency data. The specific offences are under B12, in a table you can download here. There were 21 charges of "INTENTIONALLY CAUSE A BUSHFIRE", 21 of "RECKLESSLY CAUSE A BUSHFIRE", and one of "RECK SPREAD FIRE TO VEGETATION-PROP OTHR". Only the first charge seems to be properly described as arson. But there may be more than one of these charges per incident, or per person. So I looked up this table, which said that there were 32 incidents, not 43. I could not find the number of offenders; the tables don't seem to have that data.
Update:
I found more information about the Victorian data in this CSA table, which lists incidents, with action taken. For year to Sep 2019, there were 34 B12 incidents, for which:
1. 16 charges were laid
2. 7 no charges laid
3. 11. unsolved.
This seems inconsistent with the other table saying 43 charges were laid (which Murdoch used). It may be that a lot of those 43 were withdrawn.
But of course the key fact is that this CSA data relates to the previous whole year, Oct 2018-Sept 2019. There is no overlap with this season's fires, which in Victoria did not start until after September.
So there it is. The Australian tried to beat up a NSW police statement into a "nearly 200 arson arrests" story. When that wouldn't hold, they just tried to reframe it as a national total. But the data doesn't say that at all.
Update: I see that the NY Times has a new analysis of the role of the Murdoch press in dishonestly promoting the arson (and "greenies wouldn't allow hazard reduction burns") narratives, with a link to Timothy Graham's QUT analysis of the role of bots in promoting the story.
Update: There is another article in the Telegraph which covers a lot of the same ground, but clarifies the Qld matter:
"The claim 101 people in Queensland have been arrested for arson this summer has also been circulated.
However, Queensland police said the figure includes a broader range of fire offences, including breaching of total fire bans, and was not a total of arrests, but a total of “police enforcement actions”.
Queensland police told local media that of the total reported bushfires in the state between 10 September and 8 January, around 10 per cent are believed to have been deliberately lit."
The cover-up is also based on lies.
Update
I have plotted by year the number of "deliberately start bush fire" (code 411G) offences on Victoria for the last decade (doesn't include this year). There is no recent uptick, in fact the opposite.

Update
From the Melbourne Age:
""Police are aware of a number of posts circulating in relation to the current bushfire situation, however currently there is no intelligence to indicate that the fires in East Gippsland and north-east Victoria have been caused by arson or any other suspicious behaviour," a police spokeswoman said.
The CFA incident controller in Bairnsdale, Brett Mitchell, backed up that statement on Thursday, saying that none of the recent fires in the East Gippsland area have been started by arson."
Update from The Age
"A News Corp employee has accused the organisation of a "misinformation campaign" filled with "irresponsible" and "dangerous" coverage of the national bushfire crisis, urging executive chairman Michael Miller to think about the "big picture".
...
"I have been severely impacted by the coverage of News Corp publications in relation to the fires, in particular the misinformation campaign that has tried to divert attention away from the real issue which is climate change to rather focus on arson (including misrepresenting facts)," she said."
Update: Here is an AFP factcheck. Like many such, they still have it only part right. They say
"The claim is false; while more than 380 people have been arrested for fire related offenses, including breaking recently imposed and widespread fire bans" They haven't been arrested. I haven't seen any police statistics on arrests; they list charges and cautions. A lot of charges would have been on summons. It's worth remembering that there are two false aspects to the Murdoch story - 1) all those people were arrested, and 2) they were charged with arson. I have seen a lot of factchecks that checks only one part.
But the fact check does go further into other state statistics.
The headline seems immediately misleading. The story actually says
"NSW police data shows that since November 8, 24 people have been arrested for deliberately starting bushfires, while 184 people have been charged or cautioned for bushfire-related offences."
An earlier version had said
“183 people have been charged or cautioned for bushfire-related offences since November 8", which seems to be where the headline 183 came from. But "charged or cautioned for bushfire-related offences" is very different from being arrested for arson. Australia rightly has draconian laws on fire safety in hot weather, and many of these offences relate to home barbecues, dropping cigarette butts, or fireworks.
Quite a lot has now been written on this story. Ketan Joshi has an informative Twitter thread. Snopes refutes an Infowars version of the story. Sou at HotWhopper has a lot to say on the real causes of the bushfires, and on the widespread attempts to push the "it was arsonists" line.
There is another Twitter thread by Jason Wilson, in which he notes that the story was even pushed by Trump Jr.
The prompt for the articles was this statement by NSW Police. It says:
"Since Friday 8 November 2019, legal action – which ranges from cautions through to criminal charges – has been taken against 183 people – including 40 juveniles – for 205 bushfire-related offences.
Of note:
- 24 people have been charged over alleged deliberately-lit bushfires
- 53 people have had legal actions for allegedly failing to comply with a total fire ban, and
- 47 people have had legal actions for allegedly discarding a lighted cigarette or match on land."
Note that the Australian text is already inflating. They have (later) boosted the 183 to 184, and counted the "arson" charges separately to the 183. But there is, or seems to be, a subtlety missed in the discussion. The headline now says "Bushfires: Firebugs fuelling crisis as national arson arrest toll hits 183"
. The word "national" has been added. The original version, as shown in the screenshot by Joshi and preserved in the URL, did not have it. And indeed, the article does list a number of allegations in other states, although they add to 172, not 183.
At this point, I note that a very similar story appeared in the Trump-supporting Epoch Times, headed "Police Take Legal Action Against More Than 180 in Australia for Alleged Bushfire-Related Offenses"
But from the URL, the original headline was the familiar "nearly-200-people-arrested-in-australia-for-deliberately-lighting-bushfires". They appended a correction:
"Correction: A previous version of this article, in the headline, incorrectly stated the actions police took against 183 people for alleged bushfire-related offenses in Australia. Police have taken legal action against them. The Epoch Times regrets the error."
They do acknowledge that the original headline misrepresented the NSW Police report.
Not so the Australian. They just changed the headline to switch the basis of the claim from NSW to national, even though the arithmetic doesn't add up. So I looked a little further.
The Oz said
"Queensland police say 101 people have been picked up for setting fires in the bush, 32 adults and 69 juveniles.
In Tasmania, where fires have sprung up in the north of the state and outside Hobart, four were caught setting fire to vegetation. Victoria reported 43 charged for 2019."
I can't find out much more about the Qld figure, which would have to be more than half the national claim. "Setting fires in the bush" is not necessarily arson; it could be campfires, BBQs, farmers burning off. But I did dig into the Victorian figure.
I found it is based on the Crime Statistics Agency data. The specific offences are under B12, in a table you can download here. There were 21 charges of "INTENTIONALLY CAUSE A BUSHFIRE", 21 of "RECKLESSLY CAUSE A BUSHFIRE", and one of "RECK SPREAD FIRE TO VEGETATION-PROP OTHR". Only the first charge seems to be properly described as arson. But there may be more than one of these charges per incident, or per person. So I looked up this table, which said that there were 32 incidents, not 43. I could not find the number of offenders; the tables don't seem to have that data.
Update:
I found more information about the Victorian data in this CSA table, which lists incidents, with action taken. For year to Sep 2019, there were 34 B12 incidents, for which:
1. 16 charges were laid
2. 7 no charges laid
3. 11. unsolved.
This seems inconsistent with the other table saying 43 charges were laid (which Murdoch used). It may be that a lot of those 43 were withdrawn.
But of course the key fact is that this CSA data relates to the previous whole year, Oct 2018-Sept 2019. There is no overlap with this season's fires, which in Victoria did not start until after September.
So there it is. The Australian tried to beat up a NSW police statement into a "nearly 200 arson arrests" story. When that wouldn't hold, they just tried to reframe it as a national total. But the data doesn't say that at all.
Update: I see that the NY Times has a new analysis of the role of the Murdoch press in dishonestly promoting the arson (and "greenies wouldn't allow hazard reduction burns") narratives, with a link to Timothy Graham's QUT analysis of the role of bots in promoting the story.
Update: There is another article in the Telegraph which covers a lot of the same ground, but clarifies the Qld matter:
"The claim 101 people in Queensland have been arrested for arson this summer has also been circulated.
However, Queensland police said the figure includes a broader range of fire offences, including breaching of total fire bans, and was not a total of arrests, but a total of “police enforcement actions”.
Queensland police told local media that of the total reported bushfires in the state between 10 September and 8 January, around 10 per cent are believed to have been deliberately lit."
The cover-up is also based on lies.
Update
I have plotted by year the number of "deliberately start bush fire" (code 411G) offences on Victoria for the last decade (doesn't include this year). There is no recent uptick, in fact the opposite.
Update
From the Melbourne Age:
""Police are aware of a number of posts circulating in relation to the current bushfire situation, however currently there is no intelligence to indicate that the fires in East Gippsland and north-east Victoria have been caused by arson or any other suspicious behaviour," a police spokeswoman said.
The CFA incident controller in Bairnsdale, Brett Mitchell, backed up that statement on Thursday, saying that none of the recent fires in the East Gippsland area have been started by arson."
Update from The Age
"A News Corp employee has accused the organisation of a "misinformation campaign" filled with "irresponsible" and "dangerous" coverage of the national bushfire crisis, urging executive chairman Michael Miller to think about the "big picture".
...
"I have been severely impacted by the coverage of News Corp publications in relation to the fires, in particular the misinformation campaign that has tried to divert attention away from the real issue which is climate change to rather focus on arson (including misrepresenting facts)," she said."
Update: Here is an AFP factcheck. Like many such, they still have it only part right. They say
"The claim is false; while more than 380 people have been arrested for fire related offenses, including breaking recently imposed and widespread fire bans" They haven't been arrested. I haven't seen any police statistics on arrests; they list charges and cautions. A lot of charges would have been on summons. It's worth remembering that there are two false aspects to the Murdoch story - 1) all those people were arrested, and 2) they were charged with arson. I have seen a lot of factchecks that checks only one part.
But the fact check does go further into other state statistics.
Tuesday, January 7, 2020
December global surface TempLS up 0.083°C from November.
The TempLS mesh anomaly (1961-90 base) was 0.899deg;C in December vs 0.816°C in November. This was less the 0.17°C rise in the NCEP/NCAR reanalysis base index. This makes it easily the second warmest December in the record, after the El Niño 2015. That ensured that 2019 is the second warmest year after 2016 (averaging 0.823°C vs 0.857 for 2016).
The prominent feature was the warmth of E Europe to Central Asia, extending further right through Europe and the Middle East. There was a band of cool from N India through to E Siberia. The US was quite warm, also the Chukchi Sea and Greenland/Canadian Archipelago, mostly, but a band of cool through Yukon and N Alaska. The Arctic generally was warm, and the Antarctic laso mostly warm. Australia was hot, as expected. there were two warm Pacific blobs, one NE and one East of NZ.
Here is the temperature map, using the LOESS-based map of anomalies.
 As always, the 3D globe map gives better detail.
The prominent feature was the warmth of E Europe to Central Asia, extending further right through Europe and the Middle East. There was a band of cool from N India through to E Siberia. The US was quite warm, also the Chukchi Sea and Greenland/Canadian Archipelago, mostly, but a band of cool through Yukon and N Alaska. The Arctic generally was warm, and the Antarctic laso mostly warm. Australia was hot, as expected. there were two warm Pacific blobs, one NE and one East of NZ.
Here is the temperature map, using the LOESS-based map of anomalies.
As always, the 3D globe map gives better detail.Monday, January 6, 2020
NCEP/NCAR reanalysis up 0.17°C in December.
The Moyhu NCEP/NCAR index is disrupted this month because of glitches in the data. This happened at end 2017 too (last year was the US shutdown). What happens is that the last few days stall, and then January results start to appear, without December being finished. In this case the last two days are missing, but I thought I should post, because the TempLS results which should come first are nearly ready. Since end month seems cooler than the rest, I have probably overstated the month average by a little.
Anyway, early December had a spike in warmth, so the index rose from 0.408°C in November to 0.587°C, on a 1994-2013 anomaly base. That makes it the warmest month of the year, just exceeding the earlier peak in March. New data might change that order. I don't usually make long term comparisons because of lack of homogeneity of reanalysis, but 2019 seems to be the second warmest year after 2016.
Europe, west and central Asia were warm, but cool in E China and E Siberia. Australia was famously hot, and there is a big blob of warmth in the Pacific east of NZ. US was warmish, but Canada mostly cold. Antarctica was warm, Arctic mixed.
Subscribe to:
Posts (Atom)


