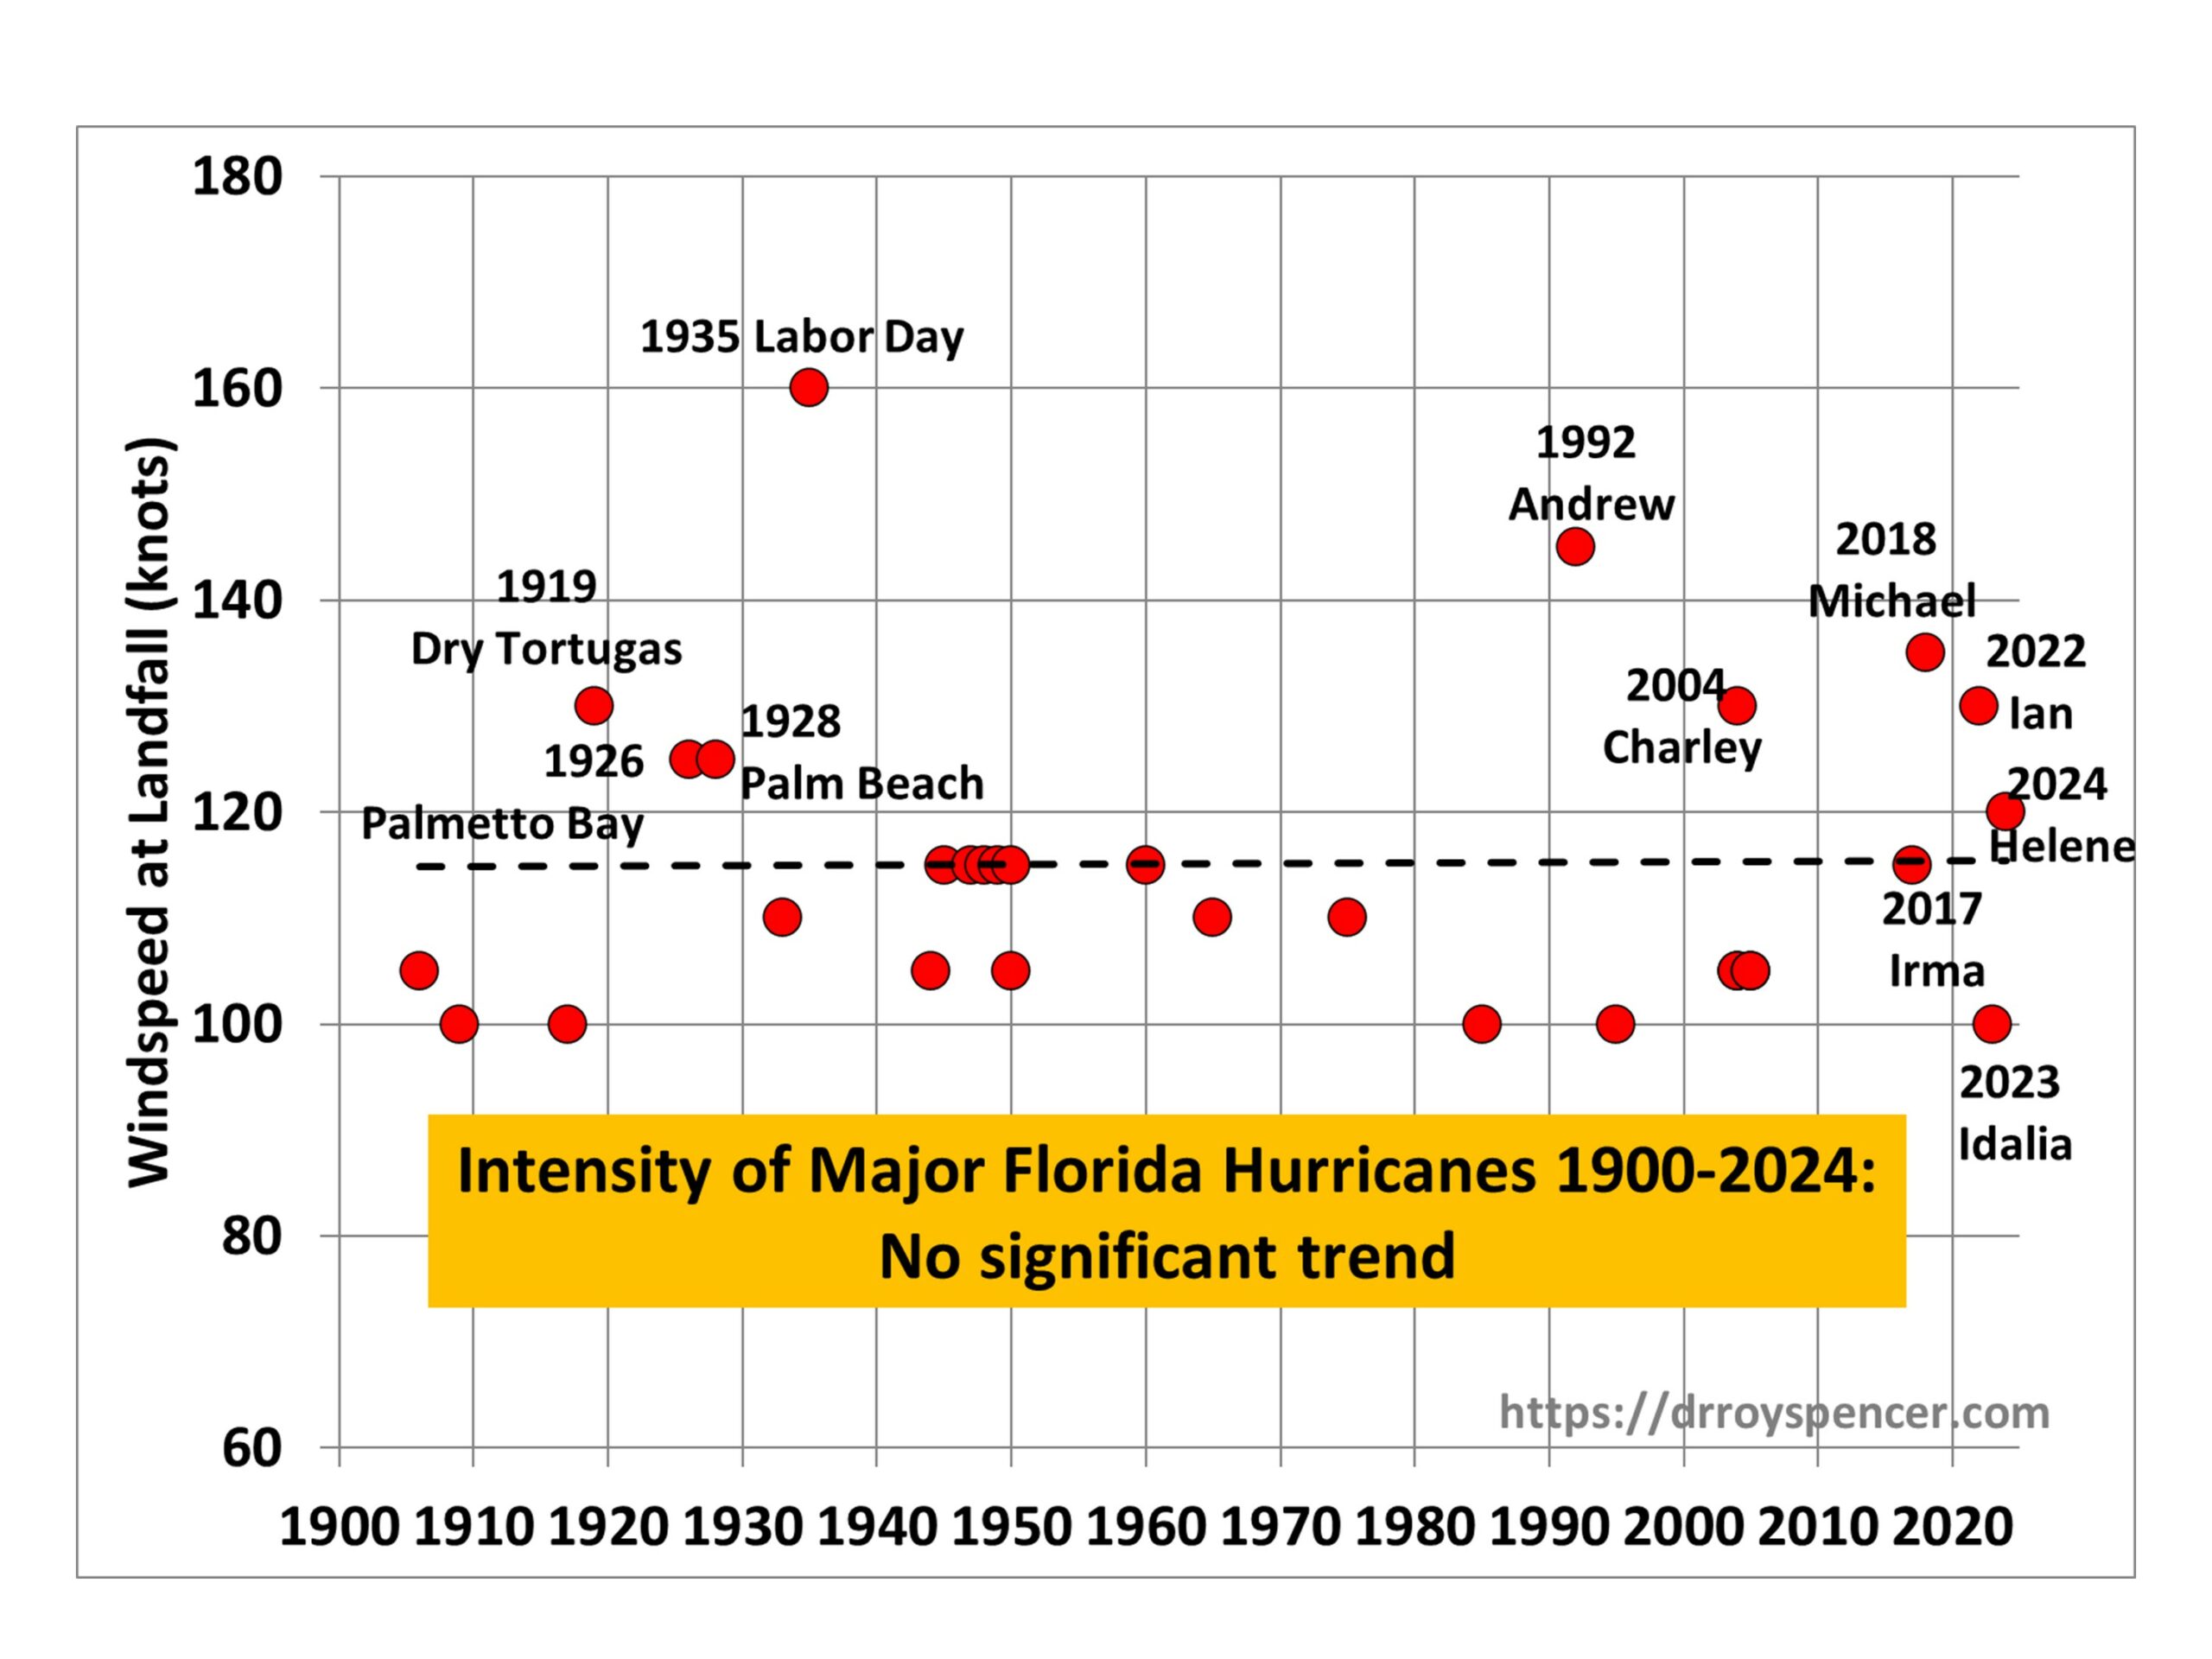
I'm writing about a post by Roy Spencer on the statistics of major hurricanes landfalling in Florida. His data comes from this Wiki table. He does a plot of intensity of major hurricanes against time:

He goes through the regression arithmetic (without error) to yield the flat line shown. So no trend? This exciting result is already doing the rounds.
The problem is one of censored data. Regression allows you to have data y with irregular spacing in t, on the assumption that there is a linear model
y=a*t+b+ε
where a and b are parameters that you estimate by fitting, and ε is a set of random residuals with mean zero (you can also estimate the sd). Put another way, the assumption is that missing data is statistically similar to the data sampled.
But here the missing years are not like that. We don't know the numbers (they were below Wiki's cut-off) but we know they were less than 100. That is what censored data means. And that just doesn't fit with the regression model.
You can see this with a simple case. Suppose we had just the 1935 hurricane, at 160 mph, and the 1992 one at 145 mph. Regression would give a down trend. But then you include the 1933 hurricane at 110. That is another big hurricane back then, so it should lower the trend further, no? No! The regression effectively averages the two to 135 mph, so now there is an uptrend. The reason is that the first regression assumed the 1933 value would be about 160. When it finds out that it is much lower, the trend goes up. And if it found out that 1934 was even lower, the trend would go up even further. And of course we do know that 1934 was less than 100.
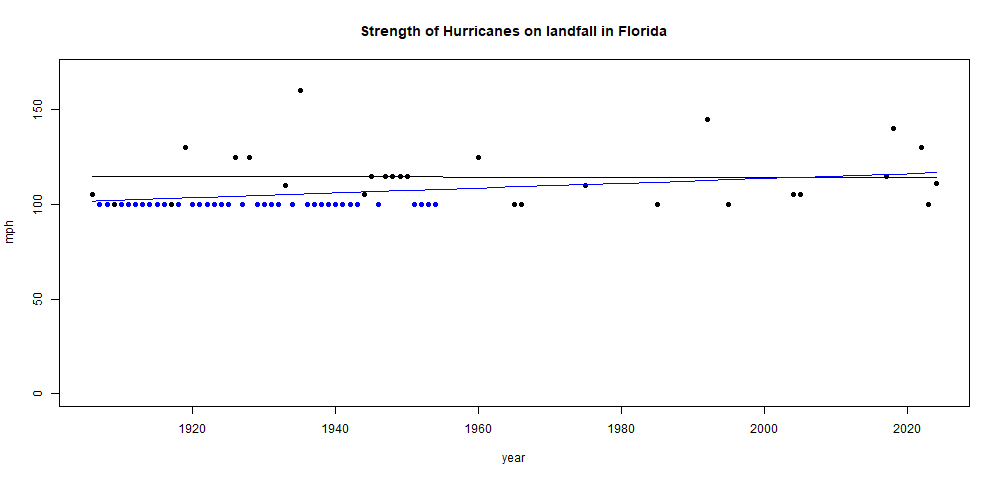
This might seem like an artefact of too few data. So let's see it played out on a larger scale. Suppose in every year from 1906 to 1955, when there wasn't a major hurricane, we add one with strength 100 mph. That has to mean that the past was windier, right? And the trend is more negative. But no, the trend goes from Roy's -0.002 mph/year to 0.127 mph/year. Here is the plot, with trend and points after the strengthening of early hurricanes in blue:

So what is the right thing to do? I'm not an expert in censored data, so I don't know. But I do know this won't work. You can see intuitively that in the last 34 years, there have been 5 hurricanes greater than 118. There were only 4 in the previous 90. That does indicate strengthening.
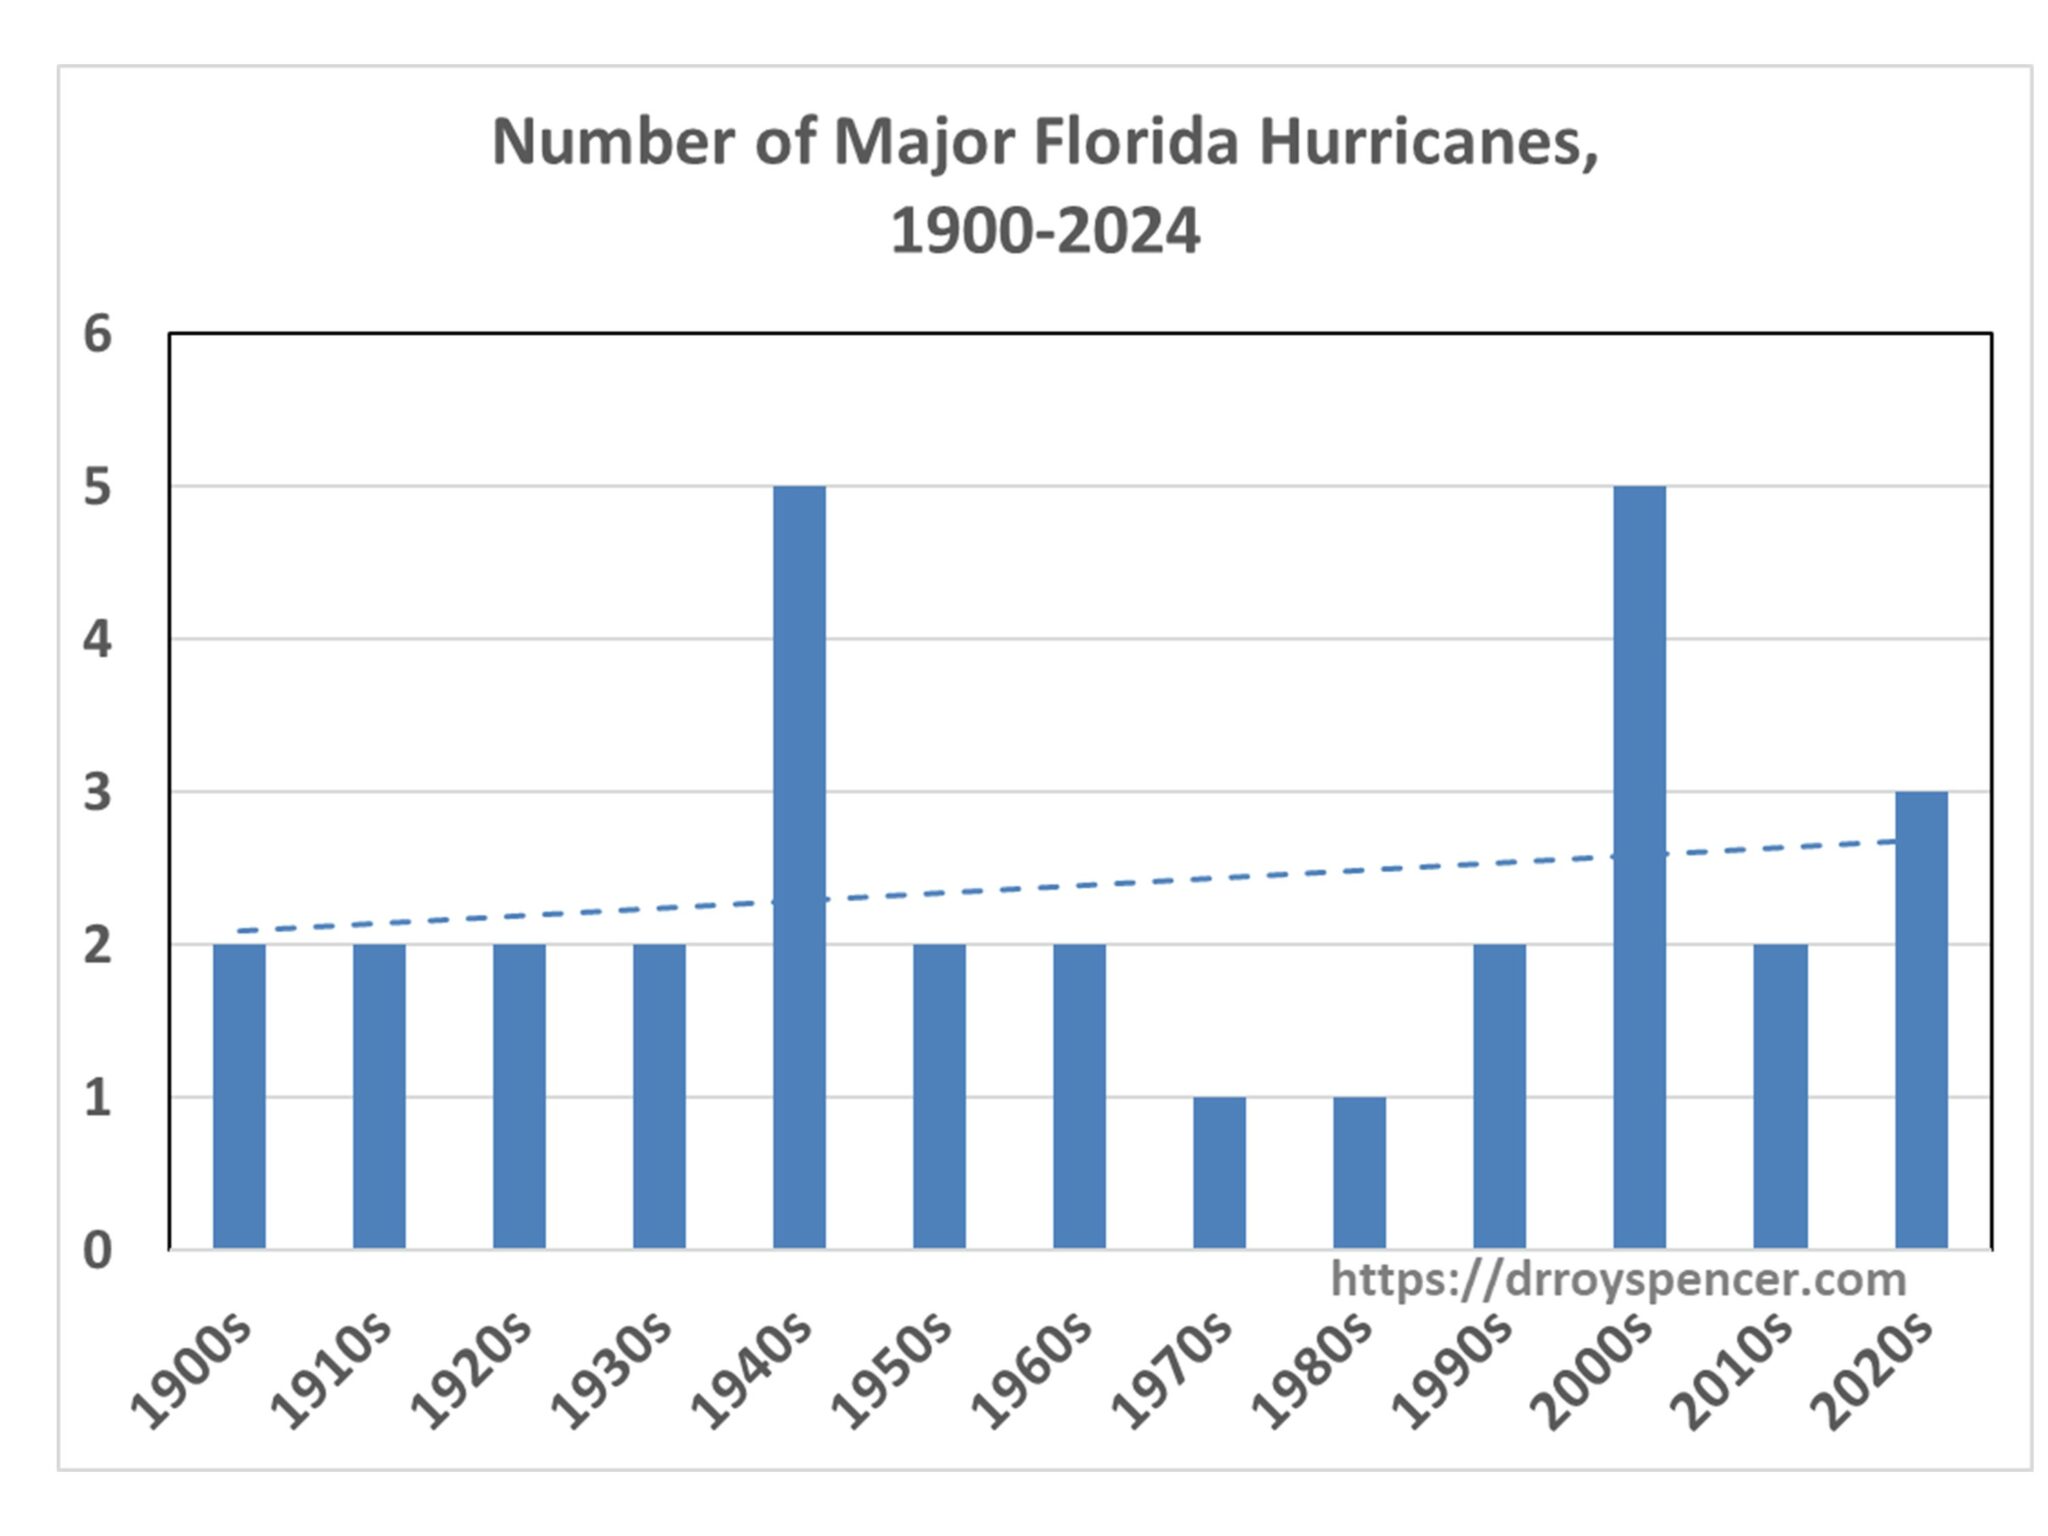
Roy did a second regression, on numbers of major hurricanes

This doen't have the same objection, because of the binning into decades. There are no missing data (except in the last decade). Years that had no major hurricanes were correctly assigned value zero in the binning. And yes, the trend is up. So this plot is not the one that is circulating.


"The trend is up." Less than one major hurricane/decade/century+.
ReplyDeleteGoing from about 2 to 2.8. That's something you'd notice. 40% increase.
DeleteAnd the confidence intervals for that 40% increase would be?
ReplyDeleteYou should ask Roy Spencer. It's his graph.
DeleteBet you never thought of that.
No I didn't, because a confidence interval is of little interest unless you think you observe a trend that is significant, which I think you did, but Roy did not.
DeleteI said the trend was up. So did Roy. And it was.
DeleteWhat Roy wrote was (quote) " The point is that there is a huge amount of natural decadal- to centennial-time scale variability in hurricane activity in Florida (or any other hurricane-prone state)". There is a difference between a trend and a significant trend, and with huge variability one should be cautious to conclude -
Deletejust like IPCC: "...; it is likely that
the global frequency of TCs will either decrease or remain essentially
unchanged, while it is more likely than not that the frequency of the
most intense storms will increase substantially in some ocean basins;
there is low confidence in projections of small-scale phenomena such
as tornadoes and hail storms; and there is medium confidence that
there will be a reduced frequency and a poleward shift of mid-latitude
cyclones due to future anthropogenic climate change."
Anon1 is moving the goalposts. The original Spencer plot was presented with this statement: "As can be seen from the linear trend line, there has been no significant trend in the intensity of major hurricanes striking Florida since 1900." Moyhu's analysis showed that Spencer's approach in the first graph is very flawed (which is unfortunate, since that graph has been used elsewhere), whereas the 2nd approach would be okay. I don't think Moyhu was saying anything about statistical significance, or whether a linear regression is actually the best approach given that global temperatures have not changed linearly, or whether any trend was influenced more by changes in GHGs, changes in aerosols, changes in land-use and dust, or natural variability. All of which would require a more sophisticated analysis than a simple linear regression.
ReplyDeleteI agree on most of what you write here. However, obviously intensity of major hurricanes (Roys first graph) is not the same as number of major hurricanes (second graph), so picking out only the last one and saying that this is OK, appears as rather selective.
ReplyDeleteIronically, IPCC states that the latter - i.e. the number of major hurricanes is unlikely to increase, but the intensity is likely to increase, and therefore the proportion of hurricanes reaching cat 4 and 5 - as reported recently by BBC (however, not more than by 10% by the time global warming has reached 1,5 degrees):
" The number of tropical cyclones globally is unlikely to increase, according to the IPCC.
But as the world warms, it says it is "very likely" they will have higher rates of rainfall and reach higher top wind speeds. This means a higher proportion would reach the most intense categories, four and five.
The more global temperatures rise, the more extreme these changes will tend to be.
The proportion of tropical cyclones reaching category four and five may increase by around 10% if global temperature rises are limited to 1.5C, increasing to 13% at 2C and 20% at 4C, the IPCC says - although the exact numbers are uncertain." https://www.bbc.com/news/world-us-canada-42251921