It was very warm in N America, most of Europe, and the Arctic. Cold patches in Central Asia and far NE Siberia. Antarctica was cold.
Here is the temperature map, using the FEM-based map of anomalies. Use the arrows at bottom to see different 2D projections.
As always, the 3D globe map gives better detail. There are more graphs and a station map in the ongoing report which is updated daily.
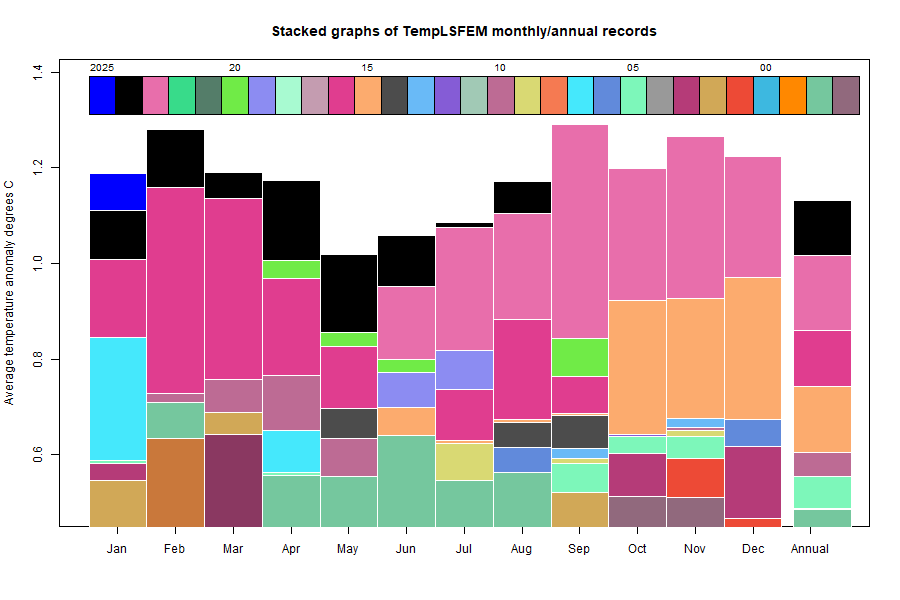
Here is the updated stacked plot of monthly values
This post is part of a series that has now run since 2011. The TempLS mesh data is reported here, and the recent history of monthly readings is here. Unadjusted GHCN is normally used, but if you click the TempLS button there, it will show data with adjusted, and also with different integration methods. There is an interactive graph using 1981-2010 base period here which you can use to show different periods, or compare with other indices. There is a general guide to TempLS here.
The reporting cycle starts with the TempLS report, usually about the 8th of the month. Then when the GISS result comes out, usually about the 15th, I discuss it and compare with TempLS. The TempLS graph uses the FEM solution on a regular near equal area grid on the sphere ; the residuals are displayed more directly using a triangular grid in a WebGL plot here.
A list of earlier monthly reports of each series in date order is here:


Thank you for the report! The NCEP/NCAR February anomaly seems to be lower than the 2016 anomaly, as far as I can see from Karsten Haustain's page http://www.karstenhaustein.com/climate.php (0.599 in 2024 vs 0.819 in 2016). In your own series with anomaly base years 1994-2013 you report 0.809 for Feb -24 vs 0.839 for Febr 2016. Do you think the GISS anomaly for Feb -24 will be a record high? best regards. T. Klemsdal, Norway
ReplyDeleteYes. My NCEP/NCARindex had it slightly lower too. It's worth remembering that reanalysis is not very homogeneous over time, and 8 years might be too long for comparison.
DeleteIt's obviously close. I think more likely than not that GISS will report a record.
Thank you - will see. The GISS anomaly for Jan -24 was 1.21 so it must up by 0.16 to beat the value for Feb. -16 at 1.37 - which is exact the change you reported for TempLS. However, considering the expected gradual increase in 8 years (i.e. around 0.16 C), it seems clear that the current Nino is both weaker and peaked earlier than the 2015-16 Nino.
DeleteFebruary would need to reach142 in GISS for the 6-month average to be exactly 0.16C higher than the peak 6 month average from 2015-2016. So this El Nino definitely peaked earlier (September v. February) (absent a 2nd peak), but whether or not it is weaker depends on what the next month or two look like. -Marcus
DeleteAlso, using a 7 month average, then Feb only needs to reach 141. And if March continues to be warm, then we could consider looking at an 8 month average, in which case, the Feb/March average would only have to reach 121 for this El Nino to match 2015/2016.
This comment has been removed by a blog administrator.
ReplyDelete