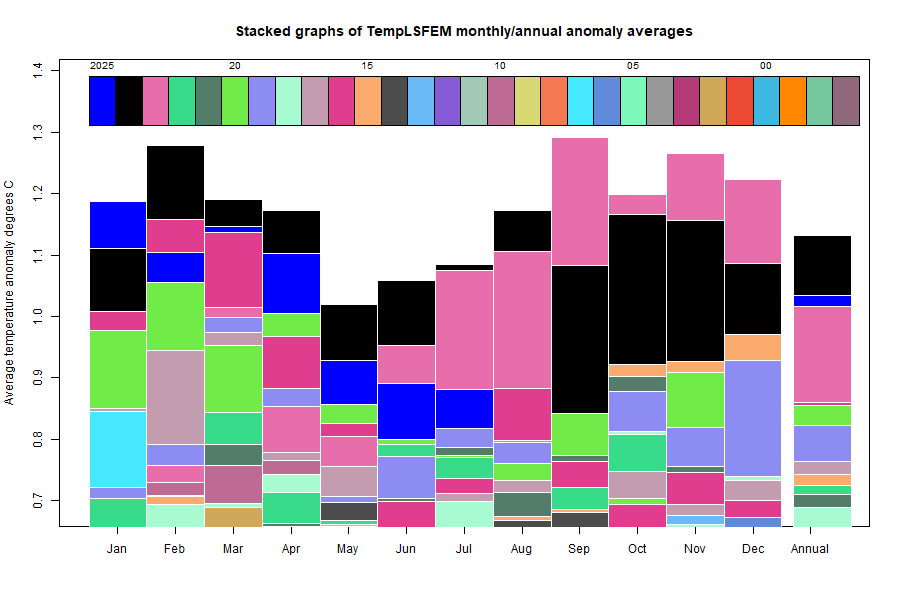
Here is the corresponding stacked graph, showing how much hotter recent months have been, as well as the now completed year of 2023:
Here is the temperature map, using the FEM-based map of anomalies. Use the arrows to see different 2D projections.
As always, the 3D globe map gives better detail. There are more graphs and a station map in the ongoing report which is updated daily.
This post is part of a series that has now run since 2011. The TempLS mesh data is reported here, and the recent history of monthly readings is here. Unadjusted GHCN is normally used, but if you click the TempLS button there, it will show data with adjusted, and also with different integration methods. There is an interactive graph using 1981-2010 base period here which you can use to show different periods, or compare with other indices. There is a general guide to TempLS here.
The reporting cycle starts with the TempLS report, usually about the 8th of the month. Then when the GISS result comes out, usually about the 15th, I discuss it and compare with TempLS. The TempLS graph uses the FEM solution on a regular near equal area grid on the sphere ; the residuals are displayed more directly using a triangular grid in a WebGL plot here.
A list of earlier monthly reports of each series in date order is here:


0 comments:
Post a Comment