Results are late this month. The main reason is again GHCN. I normally download a file called ghcn4.tavg.latest.qcu.tar.gz, which untars to give a directory with data, all with a date in the name. Usually it is the latest, with sometimes a day or two lag. But on July 3, it stopped updating. The wrapper file showed a new date, but the names on the contents remained July 3, and the file contents didn't change. There were only 1176 stations outside the US, so I couldn't post.
The wrapper is useful, because I don't have to keep updating the URL. However, I found the archive which had the actual date-named files, and they were up to date.So I downloaded the latest one. I made an error which led, for a while, to me still using a copy of the old data, but when I had fixed that, the new file had over 3000 stations outside US - good to go. I'll have to cope with the need to update the URL.
On blog matters, I've been updating the mechanics of the latest data page, so things sometimes were not showing properly. Nearly finished now, I think.
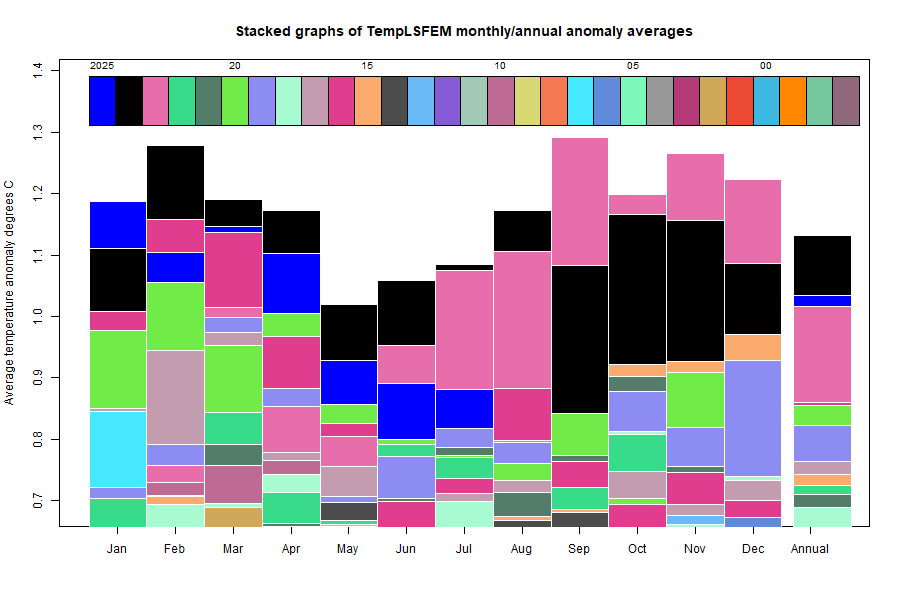
Here is the corresponding stacked graph:
Here is the temperature map, using the FEM-based map of anomalies. Use the arrows to see different 2D projections.
As always, the 3D globe map gives better detail. There are more graphs and a station map in the ongoing report which is updated daily.


 Posts
Posts

