I'd like here to collect some graphics which will put this into proportion. It comes from a collection (for various indices) that I am updating and posting on the data page. The first is oneof a kind that I show whenever there is a record year. It is just a bar chart of the temperatures, but colored in a way that shows the progress of the record values:

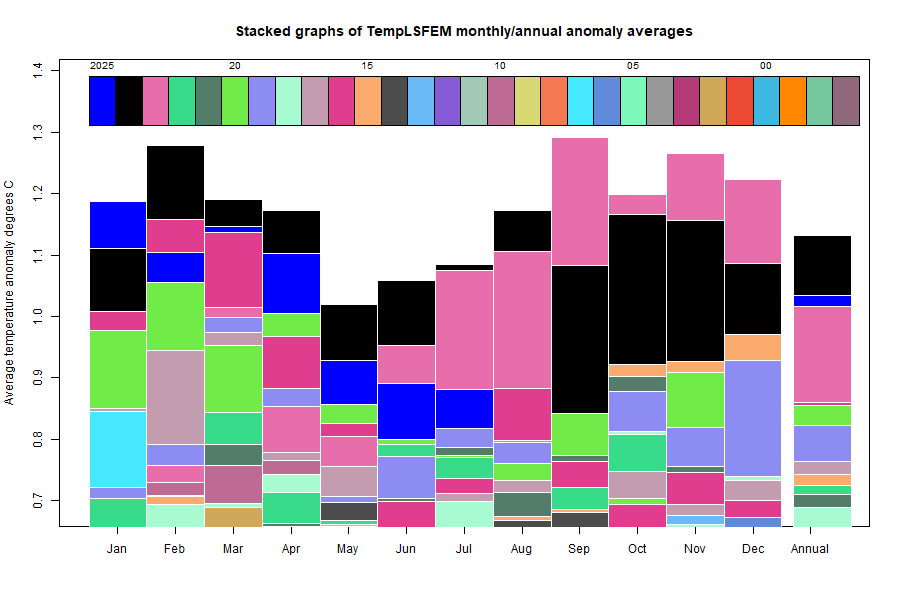
The second is one that I have been showing for a while. It is a stacked graph of monthly and annual temperatures. It is like a bar chart, but the months have been gathered in one slot, and arranged in order of size, tallest at the back. Annual is shown as well. Since June, 2023 towers over the rest:
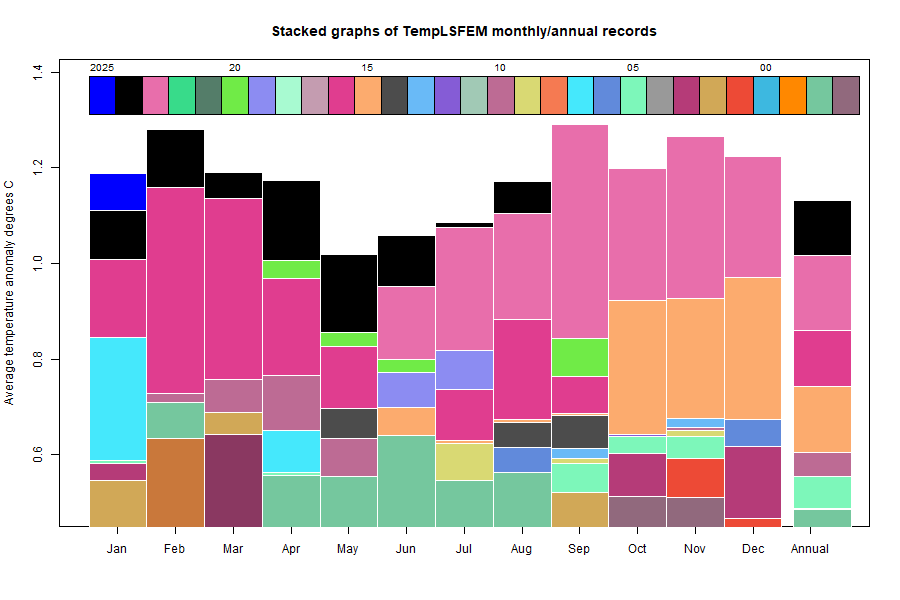
And here is a graph with a different ordering, by time, newest at the back. Each rectangle you now see was a record in its time, so gives an idea of how record setting 2023 was. 2016 was not so far behind, but based on just four very warm months. However, there is a calendar effect here. The 2015/6 peak was split between two years; taken together, they were actually larger than 2023, as you see from the annual column. Still, the current one isn't finished by any means.


0 comments:
Post a Comment