GISS rose 0.1°C. March anomaly average was 0.89°C, up from February 0.79°C January (GISS report here). That is a greater rise than TempLS mesh, which rose by 0.04°C, as did the NCEP/NCAR index. But GISS did not rise the previous month, so the change over two months is about the same. Mar 2018 is about the same as Mar 2015, but below 2016 and 2017.
The overall pattern was similar to that in TempLS. A cold band across N Eurasia, and a warm band below across mid-latitudes. Warm in N Canada and Alaska, but cool around the Great Lakes. As with last month, both show an interesting pattern of mostly warm patches in the roaring Forties.
As usual here, I will compare the GISS and previous TempLS plots below the jump.
Wednesday, April 18, 2018
Saturday, April 7, 2018
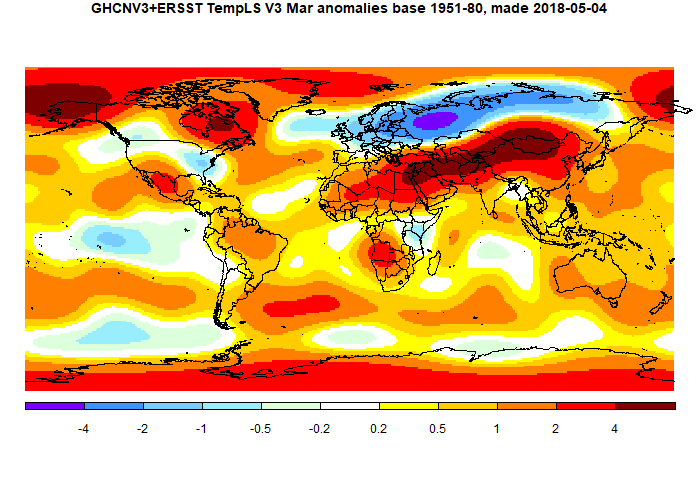
March global surface TempLS up 0.021 °C from February.
The TempLS mesh anomaly (1961-90 base) rose a little, from 0.683°C in February to 0.704°C in March. This is similar 0.046°C rise in the NCEP/NCAR index, while the satellite TLT indices rose by a similar amount (UAH 0.04°C).
There were two major bands of weather, one cold, one warm. The warm belt spread from N China to the Sahara, being very warm from Mongolia to Egypt. The cold band went from N Siberia to Britain, being very cold in NW Russia. Both poles were moderately warm. For the Arctic, this is a big reduction since last month, so indices like NOAA and HADCRUT might rise more than GISS. TempLS grid, which also undercounts poles, rose 0.07°C.
Another noticeable pattern, similar to last month, was a band of SST warmth extending right around the 35-45° S latitudes.
Here is the temperature map. As always, there is a more detailed active sphere map here.
Tuesday, April 3, 2018
March NCEP/NCAR global surface anomaly up by 0.046°C from February
March NCEP/NCAR global surface anomaly up by 0.046°C from February
In the Moyhu NCEP/NCAR index, the monthly reanalysis anomaly average rose from 0.285°C in February to 0.331°C in March, 2018, mainly due to a spike at the end of the month.
Unusually, the Arctic was mostly cool. Cold in N Russia, extending through Europe to Spain. To the south of that cold, a warm band from China to the Sahara, which was probably responsible for the net warmth. US was patchy, but more cool than warm. Interactive map here.
On prospects, the BoM says that ENSO is neutral, with neutral prospects. Currently SOI looks Nina-ish, but BoM says that is due to cyclones and will pass.
Subscribe to:
Posts (Atom)


