The GISS V4 land/ocean temperature anomaly was 1.39°C in March, down from 1.44°C in February. This fall is smaller than the 0.11°C fall reported for TempLS.
As with TempLS, March was the warmest March in the record - next was 1.35°C in 2016. It was the fourth warmest month of all kinds.
As usual here, I will compare the GISS and earlier TempLS plots below the jump.
Friday, April 12, 2024
Monday, April 8, 2024
March global surface TempLS down 0.11°C from February, but still warmest March in record.
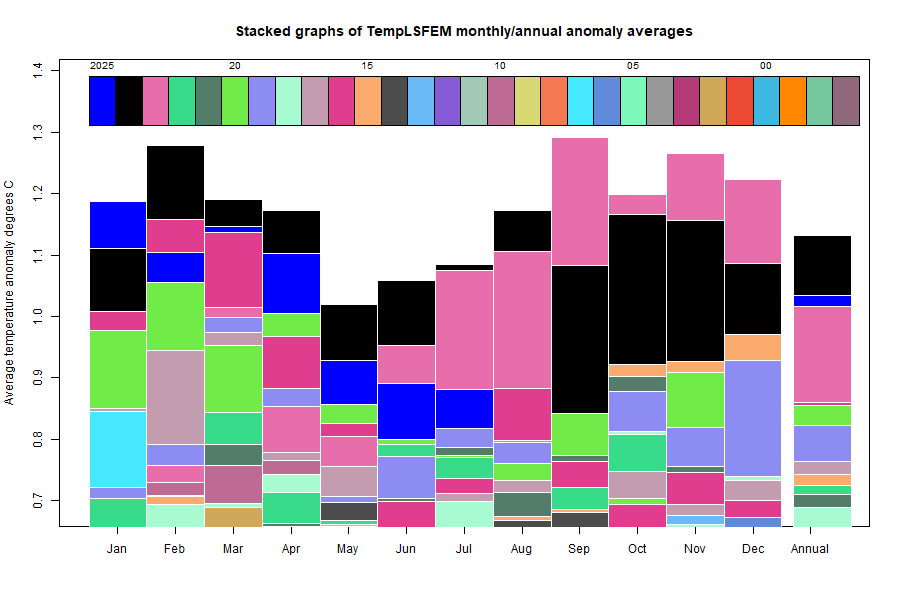
The TempLS FEM anomaly (1961-90 base) was 1.174°C in March, down from 1.284°C in February. It was still the warmest March in the record, just ahead of 1.138°C in 2016. The NCEP/NCAR reanalysis base index fell by 0.097°C.
Here is the corresponding stacked graph, showing how much hotter recent months have been, as well as the now completed year of 2023:

Here is the temperature map, using the FEM-based map of anomalies. Use the arrows to see different 2D projections.
As always, the 3D globe map gives better detail. There are more graphs and a station map in the ongoing report which is updated daily.
Here is the corresponding stacked graph, showing how much hotter recent months have been, as well as the now completed year of 2023:

Here is the temperature map, using the FEM-based map of anomalies. Use the arrows to see different 2D projections.
As always, the 3D globe map gives better detail. There are more graphs and a station map in the ongoing report which is updated daily.
Subscribe to:
Comments (Atom)


