Wednesday, April 20, 2022

Global projections for TempLS temperature reporting.

A couple of years ago I described here my way of implementing equal area projections for global data, and in particular the Mollweide and Robinson projections. Robinson would not have been a high priority, except that GISS ofers it for its temperature projections, so I can use that for comparison.

Events intruded, and I didn't implement it for routine use immediately, and when I later did, then of course mission creep crept in, and I thought of ways to use the pixel mapping methods for the actual integration (not that I am lackimg options).

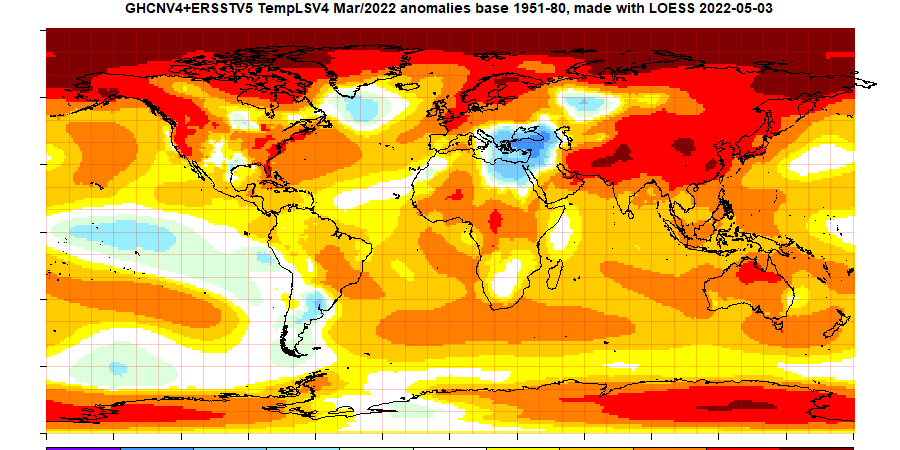
However, it really should be done. The rectangular lat/lon method that I use conveys the necessary information in an easily understood way, and I will still be using it for some internal purposes, but it overweights behaviour near the poles visually. I calculated. Here is a table of the % by pixel of colors in my plots for March 2022, shown also below. Color 11 is the warmest (>4°C)

Color: 2 3 4 5 6 7 8 9 10 11
Lat/Lon0.190.551.855.110.3913.5124.7421.6313.638.41
Robinson0.220.662.175.5510.6814.1828.0123.1311.224.18
Mollweide0.230.652.235.5610.6813.9528.5423.2311.153.77

March was a month in which the Arctic was very warm, and you can see that there were more than twice s many of the warmest pixels in the lat/lon projection (approx 8% vs 4%). The other projections are close to the true % on the sphere.

I plan to show the three projections in a single frame, with navigation buttons. Robinson will show initially, but you can cycle to Mollweide or lat/lon using the buttons below.


Friday, April 15, 2022

GISS March global temperature up by 0.16°C from February.

The GISS V4 land/ocean temperature anomaly was 1.05°C in March 2022, up from 0.89°C in February. This increase is very similar to the 0.146°C increase reported for TempLS.

As usual here, I will compare the GISS and earlier TempLS plots below the jump. A difference this time is that I'll show the Robinson projection for both. I'll post soon about usig different projections for TempLS,

Wednesday, April 6, 2022

March global surface TempLS up 0.146°C from February.

The TempLS mesh anomaly (1961-90 base) was 0.845°C in March, down from 0.699°C in February. That makes it the fifth warmest March in the record. The NCEP/NCAR reanalysis base index rose by the same 0.146°C.

The most prominent feature is warmth through Asia, the Arctic and much of N America and N Europe. There is a acold area centred on Turkey. The oceans were mostly warm except for the ENSO region.

Here is the temperature map, using the LOESS-based map of anomalies. As I mentioned in a comment last month, I plan to switch to a Robinson projection (to match GISS) but I'm not quite there yet.


As always, the 3D globe map gives better detail. There are more graphs and a station map in the ongoing report which is updated daily.