Anthony Watts has a
new report on US temperature stations. He had 2 pinned posts - the announcement
here and a 1hr Heartland video presentation
here. The subheading to the announcement reads:
"Official NOAA temperature stations produce corrupted data due to purposeful placement in man-made hot spots
Nationwide study follows up widespread corruption and heat biases found at NOAA stations in 2009, and the heat-bias distortion problem is even worse now"
Dramatic stuff. As Victor Venema
pointed out, it is the tenth anniversary of another dramatic announcement, when Anthony said he was suspending everything to rush out a paper on the bad siting of stations. The paper still has not appeared.
In this post, I'll comment briefly on the report, but mainly will discuss the more complete refutation, which is that the resulting ClimDiv US average is very close indeed to that derived from the independent purpose-built network USCRN.
The report.
It is mainly taken up with photos of various sites that WUWT observers found fault with. But the bare statistics are that they looked at 128 stations, out of a total of well over 10,000 that are currently being used, and found 5 that they deemed satisfactory. That gave rise to the headline claim "MEDIA ADVISORY: 96% OF U.S. CLIMATE DATA IS CORRUPTED".
The report is a sequel to an earlier similar study in 2009 which has been fairly central to WUWT's operations. But, aside from the question of whether the stations sighted were really as bad as they claim, there is a further question of whether they are representative. On the face of it, no. The earlier report was in the days of USHCN (pre-ClimDiv), which was a set of 1218 stations from which the national average was derived. This time, 80 of the sample were from that set, leaving only 48 from the remaining 10000+ stations. That might not be so bad, were it not that there is a history, much discussed in the report, of those stations in the earlier report. There is plenty of scope for that to be a biased sample, and there is nothing in the report to show how bias was avoided. However, this is not the main reason for doubting the report.
Comparison with USCRN
USCRN is a network since about 2005 which has about 115 stations in the continental US (conUS) built in an array intended to be representative for the region, including an avoidance of urban activity. WUWT generally thinks well of this (as do we all). The announcement said:
"“By contrast, NOAA operates a state-of-the-art surface temperature network called the U.S. Climate Reference Network,” Watts said. “It is free of localized heat biases by design, but the data it produces is never mentioned in monthly or yearly climate reports published by NOAA for public consumption."
Given that fondness, it was natural that people should
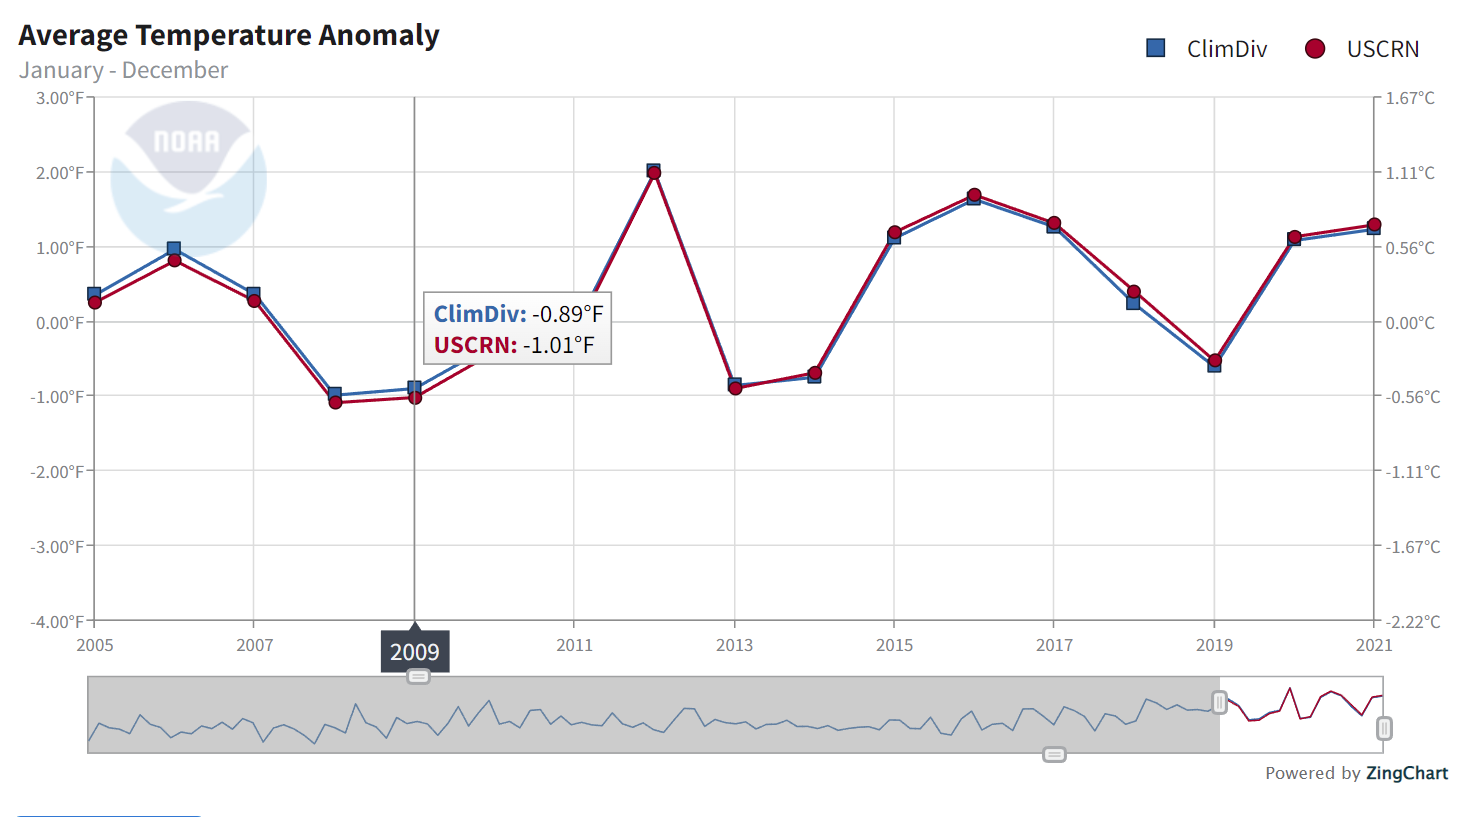
ask how ClimDiv, from the supposedly corrupted stations, compared with USCRN. Well, that is interesting. There is a very close match, as the
NOAA Temperature Index page shows:
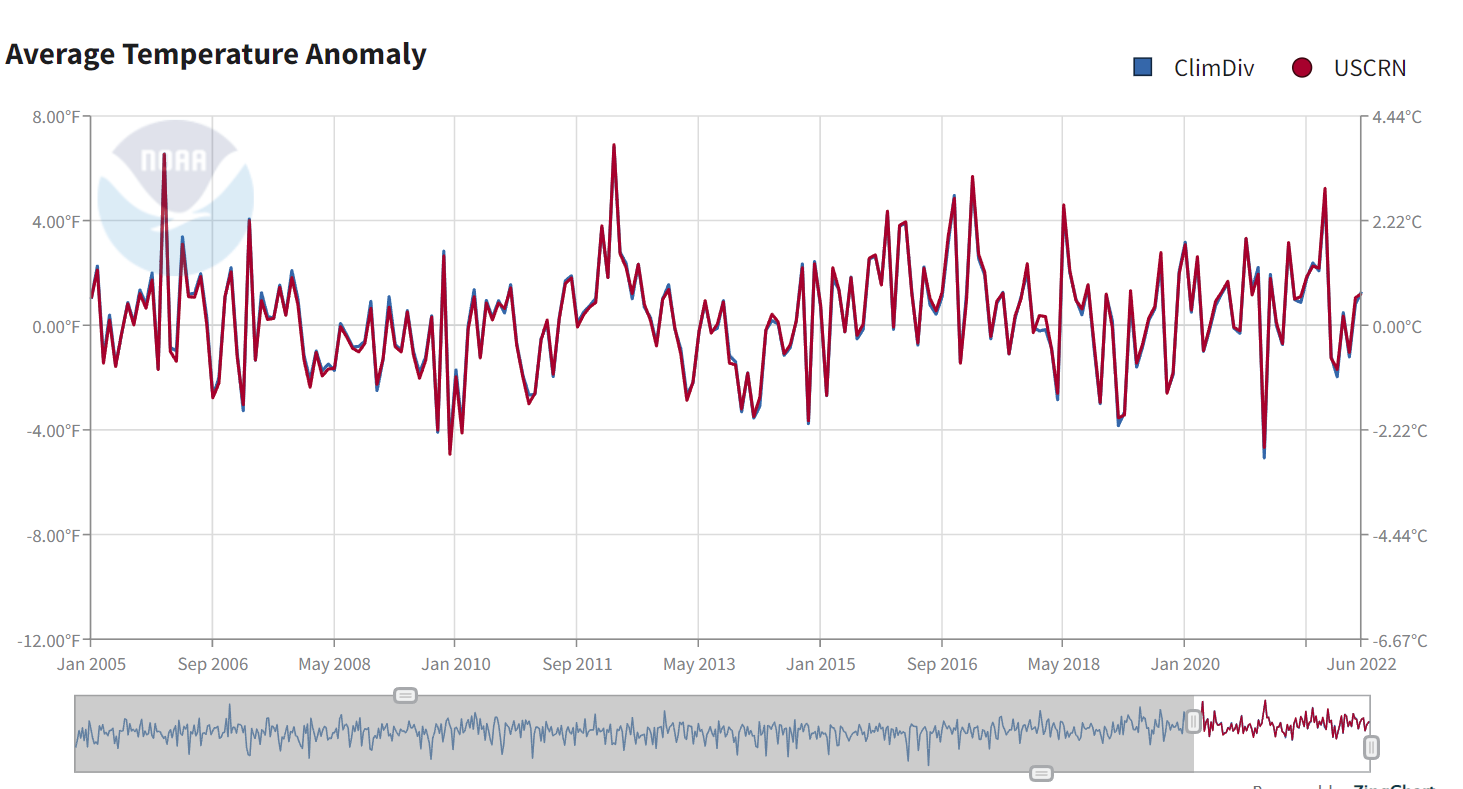
You can see little bits of blue (ClimDiv) peeping out from behind the USCRN, but mostly they totally run together. This may be a bit clearer with the annual data:
Now this comparison is not made anywhere in the report or associated writings. The monthly plot is even featured on the front page (right panel) of WUWT, but the ClimDiv part has been removed.
What is hinted in the report is that the correspondence was achieved by unstated adjustments. Here is
Anthony's response to my posting the plot:
"They use the USCRN data to ADJUST nClimDiv data to closely match. And there is only 17 years of it, which means the past century of data is still as useless and corrupted as ever."
The rest of this post is mainly discussing that. No evidence is given, of course, and it's wrong. But it's also absurd. The heading quoted above says that NOAA is deliberately biasing the stations to inflate warming, and yet, the explanation goes, after all that they throw out that effort and adjust to the USCRN.
As for the 17 years, the survey itself was in 2022. It tells about current conditions, and if they are so bad, it is now that they bad results should be appearing. Faults of more than 17 years ago will not be illuminated by scrutinising current stations.
Is the averaging process adjusted?
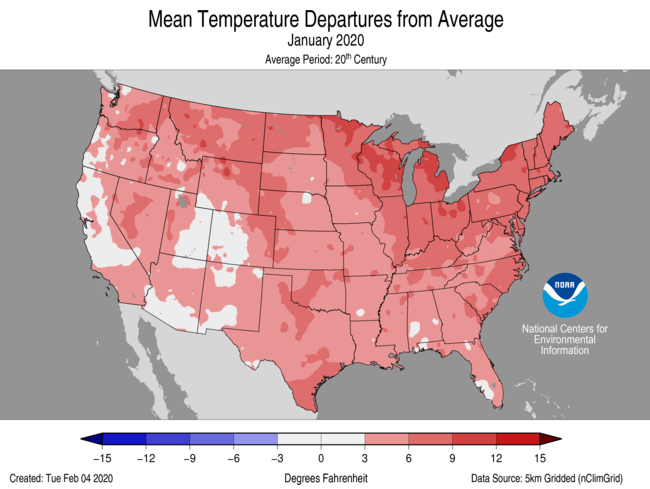
I do my own calculations here. I described two years ago how I used the monthly average station data provided by both USCRN and GHCN (proxy for ClimDiv) to emulate the NOAA calculations. The one-month calculation, with comparative maps, is
here, and the time series calculation is
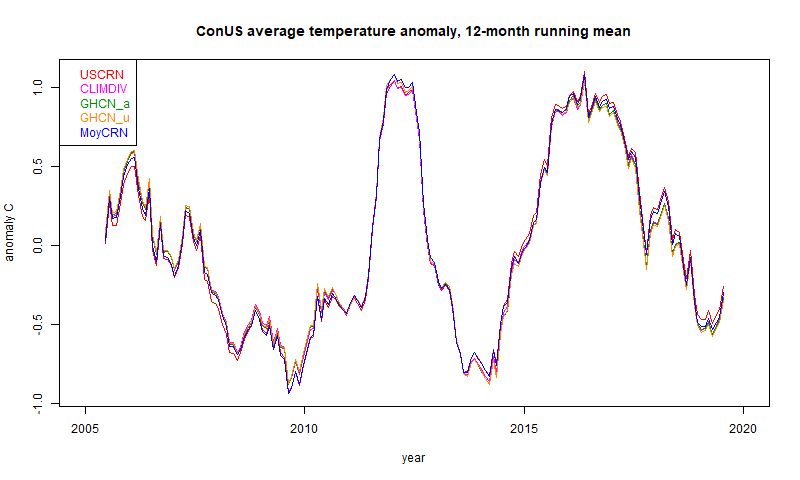
here. The key graph which corresponds to the NOAA monthly graphs, is here. Note that my results are in °C, while NOAA's are in °F.

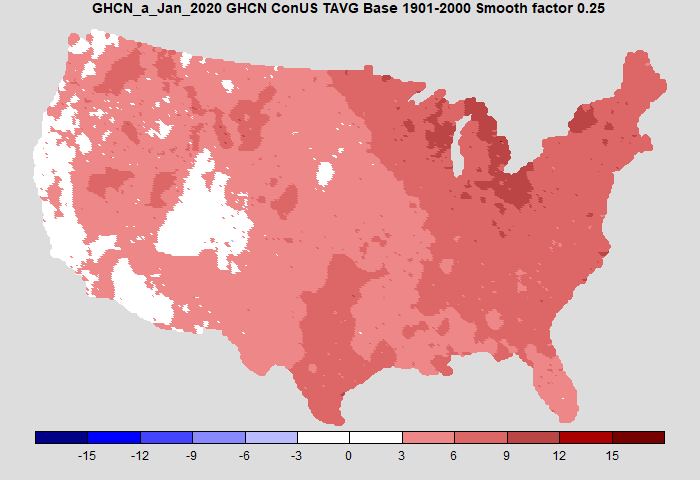
In the legend, USCRN and CLIMDIV are my rendering of the NOAA data as in the earlier plots. MoyCRN is my calculation of the average from the station USCRN data. GHCN_u is the calculation using the ConUS GHCN V4 unadjusted station data, and GHCN_a uses GHCN V4 adjusted data.
And they all move along together, whether derived from USCRN, ClimDiv/GHCN, calculated by NOAA or me, and whether or not adjusted with GHCN. Again the different behaviour is a bit clearer with a 12 month running mean plot:
So is the station data rigged?
Presumably that would be the claim. It isn't, of course, and as said above it would be completely pointless to do so. But it actually can't be. All the daily data is available within a few days at most of being read. It would be quite impractical to adjust the ClimDiv on even that timescale to match USCRN which would probably be not yet available. And of course the posted daily data comes from data which is mostly posted promptly hourly.
Plus the ClimDiv comes from 10000 or so different operators. They can't all be in the conspiracy, and they can see what is happening to their data. The conspiracy notion is ridiculous.
What if ClimDiv and USCRN were both wrong?
I pushed this line of argument, and this is where it tended to come down to. Don't trust any of 'em. But the causes of error would be quite different - supposedly various bad siting issues for ClimDiv (of many kinds)
Update - difference plot and trend
Prompted by comments, I have plotted the difference USCRN-ClimDiv. Note that the range is much less than the earlier plots.
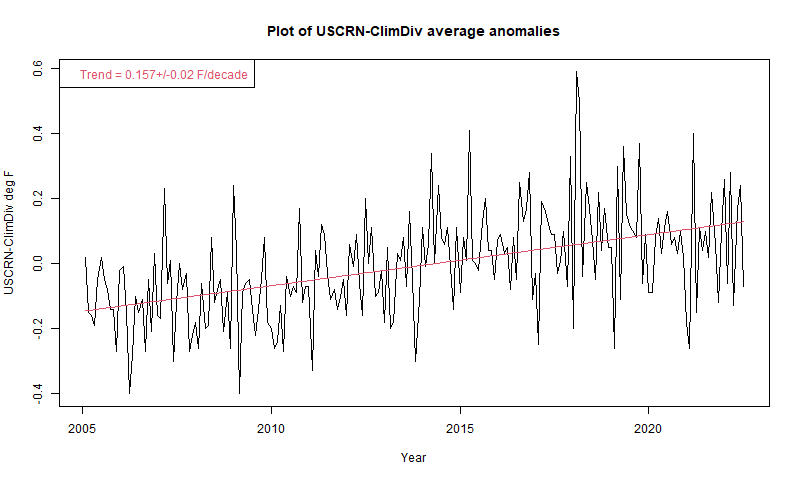
Now there is structure to the difference, and a statistically significant upward trend, as Mark B noted in comments. However, it does not indicate "corrupted data due to purposeful placement in man-made hot spots". It goes the other way - ClimDiv is warming more slowly than USCRN!Appendix - calculation method
I'll give a quick summary of my spatial averaging method here; more details are in my
earlier post. It is much less elaborate than NOAA's, but I think quite accurate. I create a fine grid - 20km is a good compromise, 10 km takes longer. Many cells have no station data, especially of course with USCRN. Then I apply the principle that stations without data are assigned a temperature equal to the average of the neighbours. Of course, the neighbours may also be unknown, but I can write down a large sparse matrix expressing these relations, and solve it (conjugate gradients). This is equivalent to solving the Laplace equation fixed at cells with data.
A test of the method is whether it can give spatial maps like those of NOAA. It can - I did that in my earlier post. Here is my comparison for January 2020:
Of course, another test is the good congruence of the time series above.