Giss Data is out, so, as I have done recently, I'll compare with the TempLS calculation. The monthly global mean anomaly average was down from 0.61°C to 0.48°C (1951-1980 base). TempLS had a small decrease (0.025°C). NOAA had an even smaller one, UAH slightly larger, and RSS had a minute rise. Numbers and plots are
here.
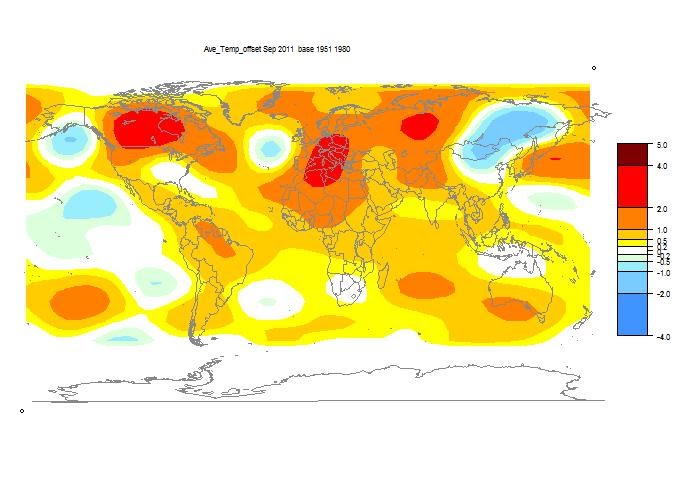
Below the jump are the GISS global plot and TempLS. Similar features, but GISS showed larger excursions. This is to be expected, as the TempLS fitting process has a smoothing effect.
Here is the GISS Plot:

And here is the TempLS plot. It comes from
this post which also showed an interactive spherical projection.


0 comments:
Post a Comment