The GISS V4 land/ocean temperature anomaly was 0.93°C in June 2020, down from 1.04°C in May. That compares with a 0.076deg;C fall in the TempLS V4 mesh index. As with TempLS, Gistemp still had June tied with 2019 as the warmest June in the record. Jim Hansen's report is here.
As usual here, I will compare the GISS and earlier TempLS plots below the jump.
Tuesday, July 14, 2020

Tuesday, July 7, 2020
June global surface TempLS down 0.076°C from May.
The TempLS mesh anomaly (1961-90 base) was 0.779deg;C in June vs 0.855°C in May. This drop was less than the fall in the NCEP/NCAR reanalysis base index, which was 0.114°C. The UAH satellite data for the lower troposphere also showed a fall of 0.11°C.
Rather surprisingly, despite two successive and substantial monthly falls, June 2020 was still the warmest June in the record, just ahead of 2019 (0.775°C). Because of the small margin, this status may change with late data.
The great warmth of E Siberia persists, although W Russia was cool, in a belt extending down to India. Much of Europe was warm, as was Antarctica.
Here is the temperature map, using the LOESS-based map of anomalies.
 As always, the 3D globe map gives better detail.
Rather surprisingly, despite two successive and substantial monthly falls, June 2020 was still the warmest June in the record, just ahead of 2019 (0.775°C). Because of the small margin, this status may change with late data.
The great warmth of E Siberia persists, although W Russia was cool, in a belt extending down to India. Much of Europe was warm, as was Antarctica.
Here is the temperature map, using the LOESS-based map of anomalies.
As always, the 3D globe map gives better detail.Saturday, July 4, 2020
NCEP/NCAR reanalysis June 2020 surface temperature down 0.114°C from May.
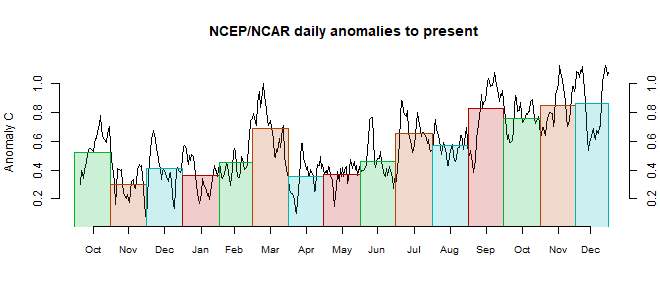
The Moyhu NCEP/NCAR index came in at 0.223°C in June, following 0.337°C in May, on a 1994-2013 anomaly base. May was already down from April, so the warm start to 2020 has definitely faded. Still, the June average was similar to June 2017 and 2018. The UAH TLT satellite temperature also declined by 0.11°C
The most notable feature was a band of cool from India north to the Arctic ocean. Generally Russia did not continue the remarkable warmth of the year to May. There was a warm band from Iran to Norway, through E Europe, and a cool strip north of the Mediterranean. Antarctica seems mostly warm.
The most notable feature was a band of cool from India north to the Arctic ocean. Generally Russia did not continue the remarkable warmth of the year to May. There was a warm band from Iran to Norway, through E Europe, and a cool strip north of the Mediterranean. Antarctica seems mostly warm.
Saturday, June 13, 2020
GISS May global down by 0.12°C from April.
The GISS V4 land/ocean temperature anomaly was 1.02°C in May 2020, down from 1.14°C in April. That compares with a 0.165deg;C fall in the TempLS V4 mesh index. As with TempLS, it was the warmest May in the record, despite the fall from April. Jim Hansen's report is here, with this graph of months in the last few years showing what happened here.

As usual here, I will compare the GISS and earlier TempLS plots below the jump.
As usual here, I will compare the GISS and earlier TempLS plots below the jump.
Wednesday, June 10, 2020
May global surface TempLS down 0.17°C from April.
The TempLS mesh anomaly (1961-90 base) was 0.844deg;C in May vs 1.014°C in April. This drop was larger the fall in the NCEP/NCAR reanalysis base index, which was 0.064°C. ERA5 showed a near-identical fall of 0.07 °C. By contrast again, the UAH satellite data for the lower troposphere showed a rise of 0.16°C.
Other reports on the reanalysis emphasised that despite the fall from April, it was still the warmest May in the record. That is true for TEmpLS too (just); May 2016 anomaly was 0.825°C.
The most prominent feature is again a very warm N Siberia, extending into the Arctic. By contrast N America except for the Pacific coast, and Eastern Europe were cool.
Last month I commented on the timing of posting, noting that now a lot of GHCN V4 data becomes available very promptly, and then there is a trickle of late data, which can sometimes have an outsize effect on the result. That creates a dilemma about whether to wait. That month the late data did not make much difference. This month the flow of data has been similar; we have 8599 stations to date, but there may be 1000 more to come, eventually. There has been little new data in the last three days. So we'll see.
Here is the temperature map, using the LOESS-based map of anomalies.
 As always, the 3D globe map gives better detail.
Other reports on the reanalysis emphasised that despite the fall from April, it was still the warmest May in the record. That is true for TEmpLS too (just); May 2016 anomaly was 0.825°C.
The most prominent feature is again a very warm N Siberia, extending into the Arctic. By contrast N America except for the Pacific coast, and Eastern Europe were cool.
Last month I commented on the timing of posting, noting that now a lot of GHCN V4 data becomes available very promptly, and then there is a trickle of late data, which can sometimes have an outsize effect on the result. That creates a dilemma about whether to wait. That month the late data did not make much difference. This month the flow of data has been similar; we have 8599 stations to date, but there may be 1000 more to come, eventually. There has been little new data in the last three days. So we'll see.
Here is the temperature map, using the LOESS-based map of anomalies.
As always, the 3D globe map gives better detail.Wednesday, June 3, 2020
NCEP/NCAR reanalysis May 2020 surface temperature down 0.064°C from April.
The Moyhu NCEP/NCAR index came in at 0.337°C in May, following 0.401°C in April, on a 1994-2013 anomaly base. It makes May the coolest month since January 2019.
Karsten Haustein commented that NCEP/NCAR had been showing some strange effects in March/April not seen in ERA5, say, and this could be part of a spurious cooling. There has been some disparity also with TempLS and other surface measures. I think the primary value of this NCEP/NCAR index has been to show changes over short time periods. I don't compare over long periods or calculate long term records. The reason is that I don't think reanalysis offers long term homogeneity; there is a changing mix of instrumentation, for example. This oddity may be a case in point that means one should not make too much of a one-time shift.
The map shows most of N America very cool, and also Northern Europe and a band from Iran to China. Warm patches in Arctic and N central Siberia. Australia cool, Antarctica mostly warm. We'll see if that is borne out by other indices. The BoM agrees Australia was cool.
Update: The UAH satellite temperatures are out; they showed a rise of 0.16°C. The map is here. It is a similar pattern, but cold places are not nearly as cold as the reanalysis, and the warm places warmer.
Karsten Haustein commented that NCEP/NCAR had been showing some strange effects in March/April not seen in ERA5, say, and this could be part of a spurious cooling. There has been some disparity also with TempLS and other surface measures. I think the primary value of this NCEP/NCAR index has been to show changes over short time periods. I don't compare over long periods or calculate long term records. The reason is that I don't think reanalysis offers long term homogeneity; there is a changing mix of instrumentation, for example. This oddity may be a case in point that means one should not make too much of a one-time shift.
The map shows most of N America very cool, and also Northern Europe and a band from Iran to China. Warm patches in Arctic and N central Siberia. Australia cool, Antarctica mostly warm. We'll see if that is borne out by other indices. The BoM agrees Australia was cool.
Update: The UAH satellite temperatures are out; they showed a rise of 0.16°C. The map is here. It is a similar pattern, but cold places are not nearly as cold as the reanalysis, and the warm places warmer.
Thursday, May 14, 2020
GISS April global down by 0.03°C from March.
The GISS V4 land/ocean temperature anomaly was 1.16°C in April 2020, down from 1.19°C in March. That compares with a 0.054°C rise in the TempLS V4 mesh index.
There is a recent oddity with GHCN V4 monthly, in that in the last 24 hours a lot of station data has gone missing. This has happened before, and gets fixed (thanks, GHCN). It shows an effect in Moyhu data in a disagreement between the report data and the overall table. The latter uses the current data with gaps. I hope that GISS has not been affected by this. My reporting system rejects new data if the total number of stations reduces by more than a small threshold.
As usual here, I will compare the GISS and earlier TempLS plots below the jump.
There is a recent oddity with GHCN V4 monthly, in that in the last 24 hours a lot of station data has gone missing. This has happened before, and gets fixed (thanks, GHCN). It shows an effect in Moyhu data in a disagreement between the report data and the overall table. The latter uses the current data with gaps. I hope that GISS has not been affected by this. My reporting system rejects new data if the total number of stations reduces by more than a small threshold.
As usual here, I will compare the GISS and earlier TempLS plots below the jump.
Subscribe to:
Posts (Atom)


 Posts
Posts

