Once again there were difficulties with GHCN data posting. GHCN usually posts a single gz file, named ghcnm.tavg.latest.qcu.tar.gz, which should contain the latest files, with names including the date. That is good for scripting when it works, with a constant url for the package. But last month, I found that new such files were posted, but with old data. So I switched to another archive directory where files had the date in their names, and seemed to be more up to date.
But early this month, the archive was not getting new files, and the old system was better. I found also a directory called access which seemed ideal - it has the latest files, dated, but uncompressed. However, eventually the archive caught up, and meanwhile the access directory vanished. However, the number of non-US stations, which is my test, has stalled at about 2700, whereas last month it went fairly quickly to 3200 Still, 2700 isn't bad, so I'll post.
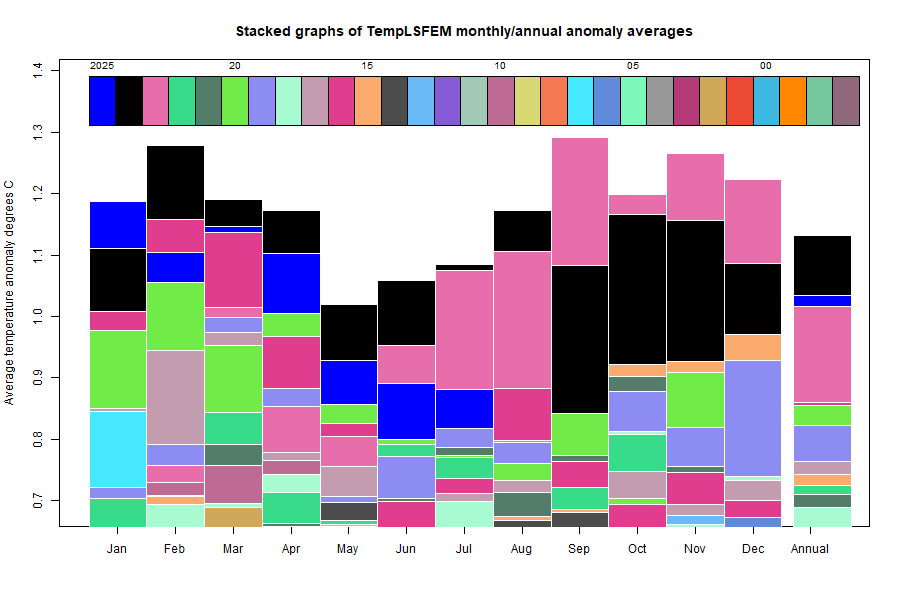
Here is the corresponding stacked graph:
Here is the temperature map, using the FEM-based map of anomalies. Use the arrows to see different 2D projections.
As always, the 3D globe map gives better detail. There are more graphs and a station map in the ongoing report which is updated daily.


 Posts
Posts

