Once again there were difficulties with GHCN data posting. GHCN usually posts a single gz file, named ghcnm.tavg.latest.qcu.tar.gz, which should contain the latest files, with names including the date. That is good for scripting when it works, with a constant url for the package. But last month, I found that new such files were posted, but with old data. So I switched to another archive directory where files had the date in their names, and seemed to be more up to date.
But early this month, the archive was not getting new files, and the old system was better. I found also a directory called access which seemed ideal - it has the latest files, dated, but uncompressed. However, eventually the archive caught up, and meanwhile the access directory vanished. However, the number of non-US stations, which is my test, has stalled at about 2700, whereas last month it went fairly quickly to 3200 Still, 2700 isn't bad, so I'll post.
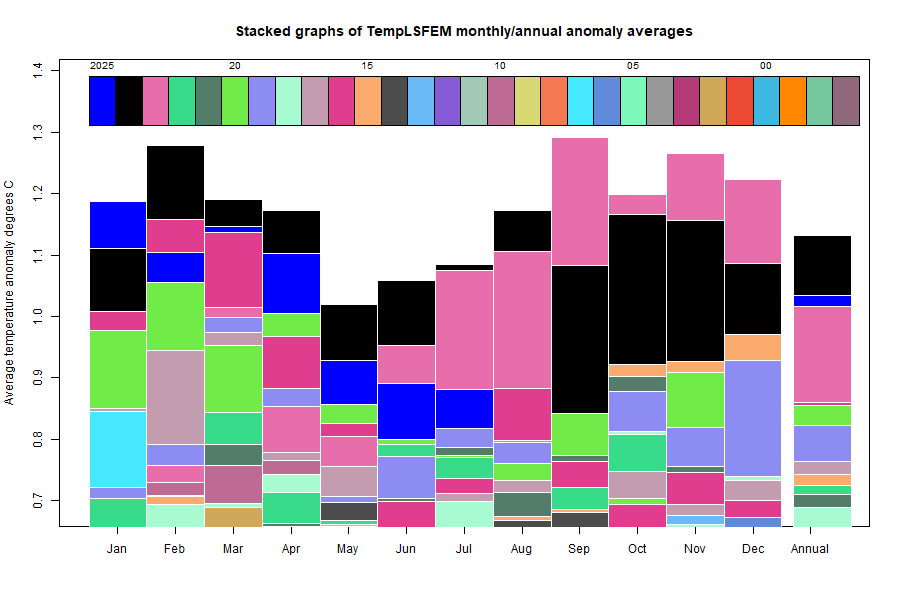
Here is the corresponding stacked graph:
Here is the temperature map, using the FEM-based map of anomalies. Use the arrows to see different 2D projections.
As always, the 3D globe map gives better detail. There are more graphs and a station map in the ongoing report which is updated daily.
This post is part of a series that has now run since 2011. The TempLS mesh data is reported here, and the recent history of monthly readings is here. Unadjusted GHCN is normally used, but if you click the TempLS button there, it will show data with adjusted, and also with different integration methods. There is an interactive graph using 1981-2010 base period here which you can use to show different periods, or compare with other indices. There is a general guide to TempLS here.
The reporting cycle starts with the TempLS report, usually about the 8th of the month. Then when the GISS result comes out, usually about the 15th, I discuss it and compare with TempLS. The TempLS graph uses the FEM solution on a regular near equal area grid on the sphere ; the residuals are displayed more directly using a triangular grid in a WebGL plot here.
A list of earlier monthly reports of each series in date order is here:


 Posts
Posts


According to the graph, 2026 is just ahead of 2024 (almost a tie). And a bit more ahead of 2023.
ReplyDeleteHello Nick,
ReplyDeleteDid you ever get to the bottom of how Ole Humlum (C4U) produced that cold-looking July 2026 global map WUWT posted recently (via Homewood, I think)?
I think you mentioned it might be some adaptation of the AIRS data.
Thanks
Hi David,
DeleteYes, I think so. There is more commentary further down. It seems he picked up AIRS data posted by GISS, for surface radiance, converted by someone to temperature. As Bellman noted, you can actually get GISS to post a similar plot, with rather similar results to Humlum.
The surface radiance data has been around for a long time, and is well recognised to be unsuitable for this purpose. One clear reason is that detection is blocked by clouds. But another, worse, is that there is no predictable relation between surface radiation and air temperature. There is variation of emissivity, which changes with vegetation patterns. But even more, just the difference in skin temperature with material. A concrete path through lawn. Grass is cool, concrete hot, but the air temperature at 2m is about the same.
Hi Nick. Just like to point out that the Blog roll doesn't seem to be updating. The last post of WUWT bunkum is over 6 days old.
ReplyDeleteYes. I don't have much control over that.
DeleteActually there have been complaints that the WUWT RSS feed is failing.
Delete