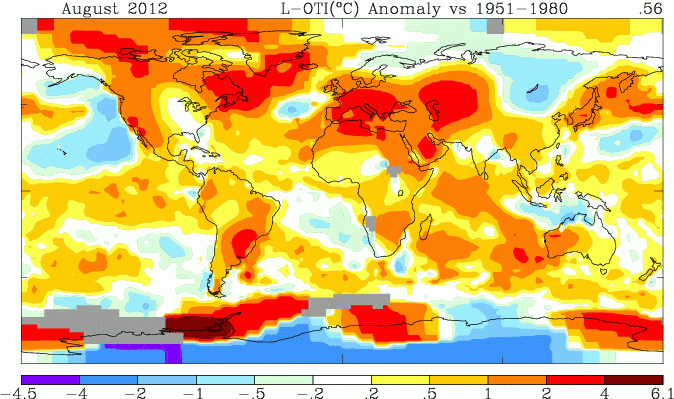
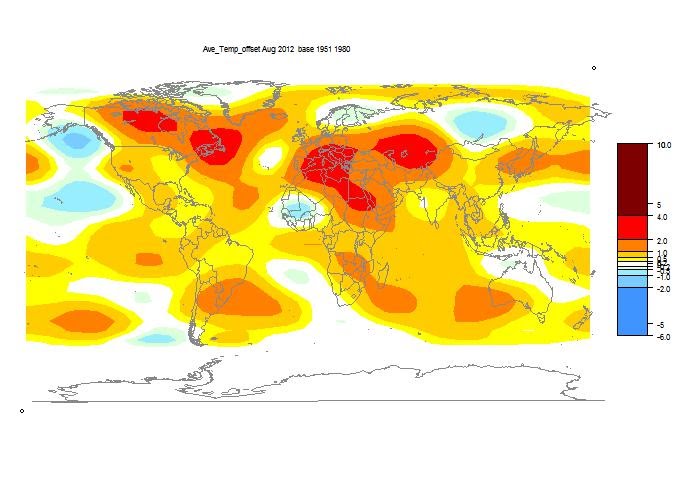
The GISS land/sea monthly anomaly rose from 0.47°C July to 0.56°C in August. GISS has recently been more volatile than other land indices (though similar to satellite), and again this month TempLS was steady. Time series and graphs are shown here
Meanwhile, Arctic ice has been slowly melting. I've added a line on the monitoring page where you can see what minimum will be reached if melting follows the pattern of previous years. The current IJIS JAXA extent is 3,542,000 sq km, which is 749,000 sq km below the previous record minimum in 2007. The greatest further melting in recent years (2006-) was in 2010; if we follow that pattern it will reach 3,357,000 sq km. IJIS is still melting - NSIDC has shown some refreezing, but that may change again.
As usual, I compare the previously posted TempLS distribution to the GISS plot.
Here is GISS:

And here is the previous TempLS spherical harmonics plot:

.
Previous Months
JulyJune
May
April
March
February
January
December 2011
November
October
September
August 2011
More data and plots


0 comments:
Post a Comment