I'm
on the outer again at WUWT (update - seems OK now). The issue is recent heat records, which WUWT wants to challenge because of alleged inadequacies in the stations. Not that the thermometers were inaccurate, but that the environment was not representative of climate. My contention was that this was only relevant to climate science if scientists were using them as representative of climate, and for most of the stations at issue, they weren't.
Since I did quite a bit of reading about it, I thought I would set down the issues here. The basic point is that there are a large number of thermometers around the world, trying to measure the environment for various purposes. Few now are primarily for climate science, and even fewer historically. But they contain a lot of information, and it is the task of climate scientists to select stations that do contain useful climate information. The main mechanism for doing this is the archiving that produces the
GHCN V3 set. People at WUWT usually attribute this to NASA GISS, because they provide a handy interface, but it is GHCN who select the data. For current data they rely on the WMO CLIMAT process, whereby nations submit data from what they and WMO think are their best stations. It is this data that GISS and NOAA use in their indices. The UKMO use a similar selection with CRUTEM, for their HADCRUT index.
At WUWT, AW's repeated complaint was that I don't care about accuracy in data collection (and am a paid troll, etc). That is of course not true. I spend a lot of time, as readers here would know, trying to get temperature and its integration right. But the key thing about accuracy is, what do you need to know? The post linked above pointed to airports where the sensor was close to the runways. This could indeed be a problem for climate records, but it is appropriate for their purpose, which is indeed to estimate runway temperature. The key thing here is that those airport stations are not in GHCN, and are not used by climate scientists. They are right for one task, and not used for the other.
I first encountered this WUWT insistence that any measurement of air temperature had to comply with climate science requirements, even if it was never used for CS, in
this post on supposed NIWA data adjustments in Wellington. A station was pictured and slammed for being on a rooftop next to air conditioners. In fact the sataion was on a NIWA building in Auckland, but more to the point, it was
actually an air quality monitoring station, run by the Auckland municipality. But apparently the fact that it had no relation to climate, or even weather, did not matter. That was actually the
first complaint that I was indifferent to the quality of meteorological data.
A repeated wish at WUWT was that these stations should somehow be disqualified from record considerations. I repeatedly tried to get some meaning attached to that. A station record is just a string of numbers, and there will be a maximum. Anyone who has access to the numbers can work it out. So you either have to suppress the numbers, or allow that people may declare that a record has been reached. And with airport data, for example, you probably can't suppress the numbers, even if you wanted. They are measured for safety etc, and a lot of people probably rely on finding them on line.
Another thing to say about records is that, if rejected, the previous record stands. And it may have no better provenance than the one rejected. WUWT folk are rather attached to old records. Personally, I don't think high/low records are a good measure at all, since they are very vulnerable to error. Averages are much better. I think the US emphasis on daily records is regrettable.
The first two posts in the WUWT series were somewhat different, being regional hot records . So I'll deal with them separately.
Motherwell
The WUWT post is
here, with a follow-up
here. The story, reported by many news outlets, was briefly this. There was a hot day on June 28 in Britain, and Motherwell, near Glasgow, posted a temperature of 91.8°F, which seemed to be a record for Scotland. A few days later the UKMO, in a
blog post, said that they had investigated this as a possible record, but rules it out because there was a parked vehicle with engine running (later revealed as an ice-cream truck) close by.
As might be feared, this led in comments to accusations of dishonesty and incompetence at the UKMO, even though they had initiated and reported the investigation. But one might well ask, how could it happen that that could happen at a UKMO station?
Well, the answer is that it isn't a UKMO station. As the MO blog explained, the MO runs:
"a network comprised of approximately 259 automatic weather stations managed by Met Office and a further 160 manual climate stations maintained in collaboration with partner organisations and volunteer observers"
Motherwell is a manual station. It belongs to a partner organisation or volunteers (the MO helps maintain it). They have a scheme for this
here. You can see there that the site has a rating of one star (out of five), and under site details, in response to the item "Reason for running the site" says, Education. (Not, I think, climate science).
So Motherwell is right down the bottom of the 400+ British stations. Needless to say, it is not in GHCN or CRUTEM, and is unlikely to ever be used by a climate scientist, at least for country-sized regional estimates.
So to disqualify? As I said above, you can only do this by suppressing the data, since people can work out for themselves if it beats the record. But the data has a purpose. It tells the people of Motherwell the temperature in their town, and it seems wrong to refuse to tell them because of its inadequacy for the purposes of climate science, which it will never be required to fulfil.
The WUWT answer to this is, but it was allowed to be seen as a setter of a record for Scotland. I don't actually think the world pays a lot of attention to that statistic, but anyway, I think the MO has the right solution. Post the data as usual (it's that or scrub the site), and if a record is claimed, vet the claim. They did that, rejected it, and that was reported and respected.
Ouarglu, Algeria
The WUWT post is
here. On 5 July, this airport site posted a temperature of 124°F, said to be a record for Africa. There have been higher readings, but apparently considered unreliable. The WUWT heading was
"Washington Post promotes another potentially bogus “all time high” temperature record"
But "potentially bogus" is what they would call a weasel word. In fact, all that is known is that the site is an airport (not highly trafficked). There is speculation on where the sensor is located, and no evidence that any particular aircraft might have caused a perturbation. The speculated location is below (red ring).
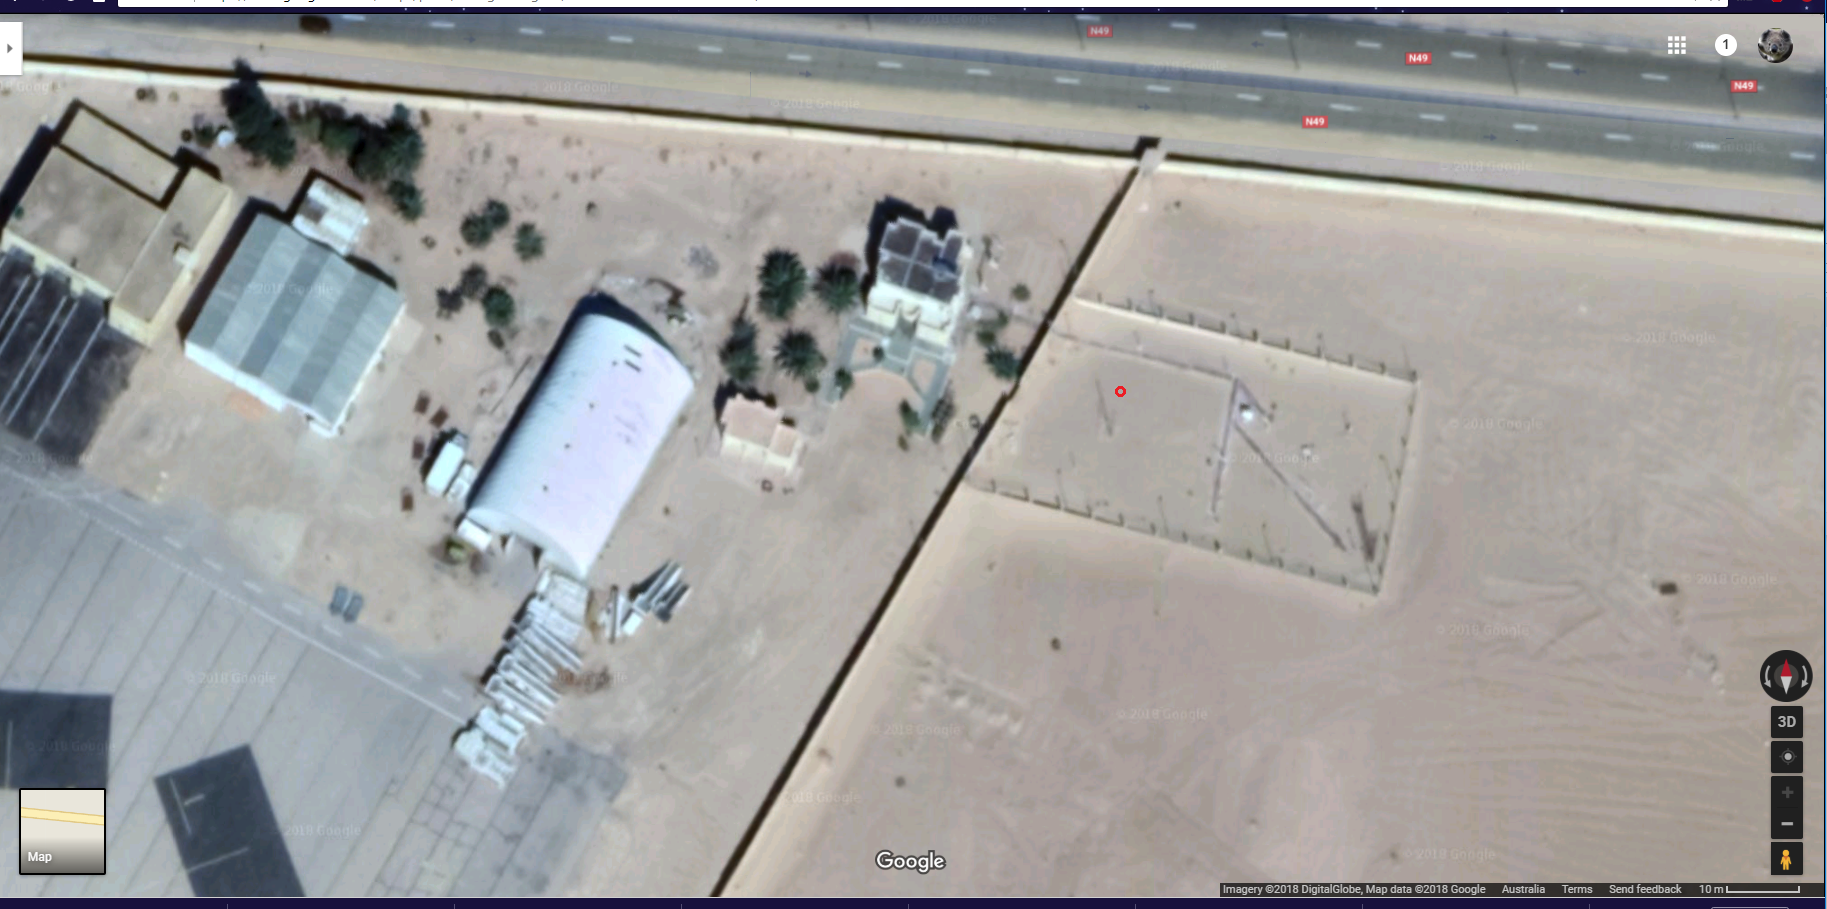
It is actually 92m from the nearest airport tarmac, and 132 m from the nearest black rectangle, which are spaces where an aircraft might actually be parked. It seems to me that that is quite a long way (It is nearly 400 m to the actual runway), and if one was to be picky, the building at about 25m and the road at 38 m would be bigger problems. But these are not airport-specific problems.
A point this time is that Ouarglu is indeed a GHCN monthly station. For the reasons I have described, it does seem relatively well fitted for the role (assuming that the supposed location is correct).
Los Angeles
The
final post (to now) was on high temperatures around Los Angeles on 6 and 7 July. Several places were said to have either reached their maximum ever, or the maximum ever for that day. The WUWT heading was
"The all time record high temperatures for Los Angeles are the result of a faulty weather stations and should be disqualified"
But it is very odd to suggest that a station should be disqualified from expressing its own record high. That is just the maximum of those figures, so if you disqualify the record high, you must surely disqualify the station. But why only those that record a record high?
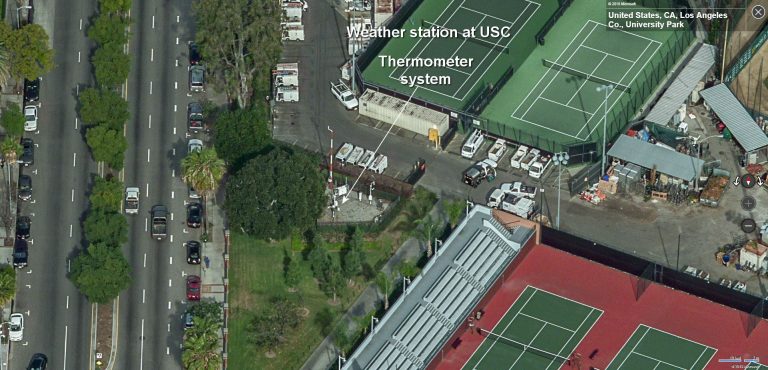
Anyway, the complaints came down to the following (click to enlarge):
 |  |  |  |
| USC | LA Power and Light | Van Nuys Airport | Burbank Airport |
There were also sites at UCLA and Santa Ana Fire Station, which were on rooftops. Now the first thing about these is that are frequently quoted local temperature sites, but apart from USC, none of them get into GHCN V3 currently (Burbank has data to 1966). So again, they aren't used for climate indices like GISS, NOSS or HADCRUT. But the fact that, whatever their faults, they are known to locals means that the record high, for that site, is meaningful to LA Times readership. And it is apparent from some of the WUWT comments that the suggestion that it was in fact very hot accords with their experience.
Again, the airport sites are clearly measuring what they want to measure - temperature on the runway. And climate scientists don't use them for that reason. UCLA seems to be there because it is next to an observatory. I don't know why the Fire Station needs a themometer on the roof, but I expect there is a reason.
As a general observation, I think it is a rather futile endeavour to try to suppress record highs on a generally hot day because of site objections. Once one has gone, another will step up. And while one record might conceivably be caused by, say, a chance encounter with a plane exhaust or aircon, it would be a remarkable coincidence for this to happen to tens of stations on the same day. Occam would agree that it was a very hot day, not a day when all the planes aligned.
Conclusion
People take the temperature of the air for various reasons, and there is no reason to think the measurement is inaccurate. The WUWT objection is that it is sometimes unrepresentative of local climate. The key question then is whether someone is actually trying to use it to represent local climate. They don't bother to answer that. The first place to look is whether it is included in GHCN. In most cases here, it isn't. Where it is, the stations seem quite reasonable.




 Posts
Posts

