I've been holding off posting this month because, although it didn't take long to reach an adequate number of stations, there are some sparse areas. Australia in particular has only a few stations reporting, and Canada seems light too. Kazakhstan, Peru and Colombia are late, but that is not unusual. It is a puzzle, because Australia seems to have sent in a complete CLIMAT form, as shown at Ogimet. But, as said, I think there are enough stations, and it seems there may not be more for a while.
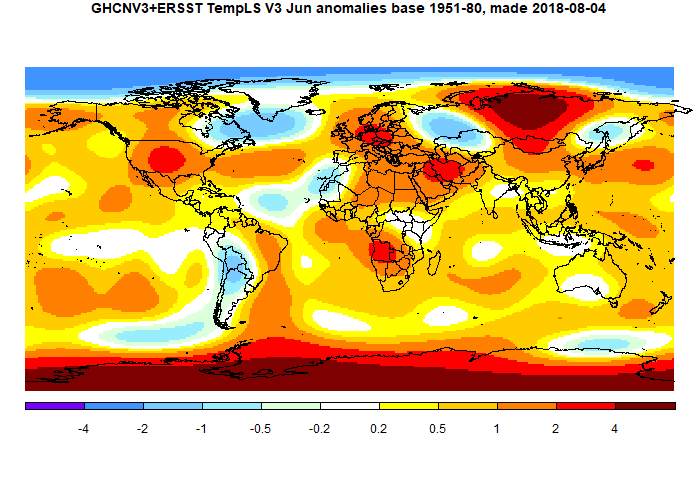
It was very warm in central Siberia and Antarctica, and quite warm in Europe US and most of Africa. Cold in much of S America, and Quebec/Greenland (and ocean).
Here is the temperature map. As always, there is a more detailed active sphere map here.
This post is part of a series that has now run since 2011. The TempLS mesh data is reported here, and the recent history of monthly readings is here. Unadjusted GHCN is normally used, but if you click the TempLS button there, it will show data with adjusted, and also with different integration methods. There is an interactive graph using 1981-2010 base period here which you can use to show different periods, or compare with other indices. There is a general guide to TempLS here.
The reporting cycle starts with a report of the daily reanalysis index on about the 4th of the month. The next post is this, the TempLS report, usually about the 8th. Then when the GISS result comes out, usually about the 15th, I discuss it and compare with TempLS. The TempLS graph uses a spherical harmonics to the TempLS mesh residuals; the residuals are displayed more directly using a triangular grid in a better resolved WebGL plot here.
A list of earlier monthly reports of each series in date order is here:


June 2018 is actually the second warmest June in the TempLS mesh dataset, and practically a tie with the warmest, only 0.004 below 2016. However, things can still change when all data is in..
ReplyDeleteWith almost all met station data in, the June temp has dropped to 0.681 C. Still the second warmest June but not so close to 2016 anymore.
DeleteI think that Australia changed to cooler colours with complete data..
When I run comparisons between June and July and December and January, June and July typically have lower anomalies. is that not generally true?
Delete" is that not generally true?"
DeleteIt depends on the anomaly base. If June and July happened to be warmer in those years, then anomalies are likely to show up cooler in later years.
The northern Hemisphere temperature trend is larger than the annual average in February to April. In June to September the northern Hemisphere temperature trend is smaller then the annual average. The anomalies growth to larger values in recent years in months with larger trends.
ReplyDeleteThe southern Hemisphere temperature trend is more uniform.