There are various notions of station here. BoM actually has a huge set, but many have rainfall data only, and those are omitted here. There is a subset that have AWS, and post data in a different way, to which I provide a separate portal button. Then there is the ACORN set, which is a set of 110 well maintained and documented stations, for which the data has been carefully homogenised. It starts in 1910. BoM seems proud of this, and the resulting publicity has led some to think that is all they offer. There is much more.
I've tried to provide the minimum of short cuts so that the relevant further choices can be made in the BoM environment. For example, asking for daily data will give a single year, but then you can choose other years. You can also, via BoM, download datafiles for individual stations, daily for all years, or in other combinations.
The BoM pages are very good for looking up single data points. They are not so good if you want to analyse data from many stations. Fortunately, all the data is also on GHCN Daily, for which I have a portal on the same page. It takes a while to get on top of their system - firstly generating the station codes, and then deciphering the bulky text file format. But it's there.
For the new portal, the top of the table looks like this:

If you click on the red-ringed button, it shows this:
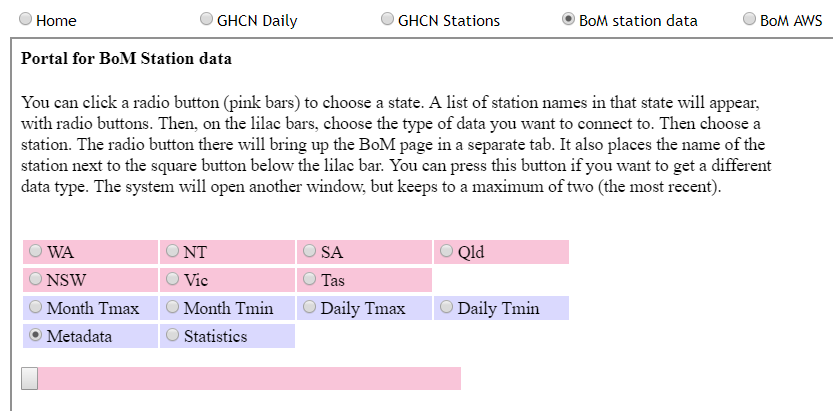
To get started, you need to choose a state. Then a list of stations, each with a radio button, will appear below. Then, from the lilac bar, you should choose a data type, eg daily Tmax. Then you can click on a station button. Your selection will appear in a new tab to which your browser takes you. From there you can makes further choices in the BoM system.
Your station choice will also appear beside the square button below the lilac (and above the stations). This button now has the same functionality as the station button below, so you don't have to scroll down to make new data choices. You can indeed make further data choices. These will make new tabs, to facilitate comparisons, but up to a max of the two most recent.


0 comments:
Post a Comment