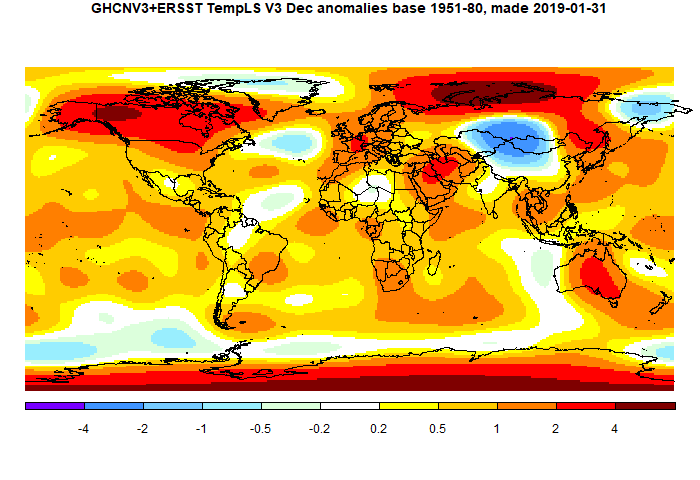
The main cold region was N America (except west coast/Alaska), extending up through the Arctic archipelago. Elsewhere Europe was warm, extending into Africa. Also Alaska/E Siberia.
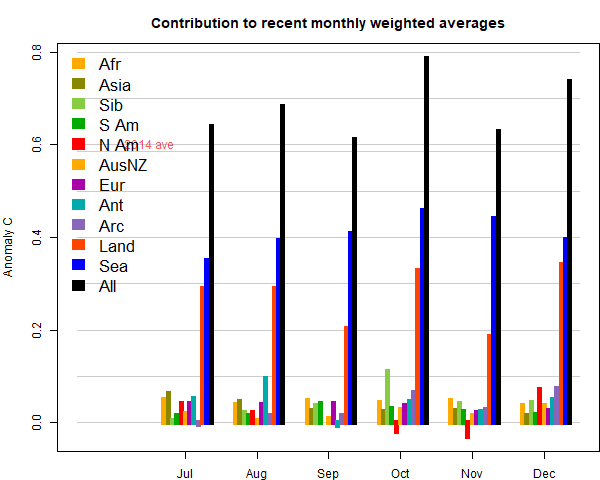
Here (from here) is the plot of relative contributions to the rise (ie components weighted by area):
Here is the temperature map. As always, there is a more detailed active sphere map here.
This post is part of a series that has now run since 2011. The TempLS mesh data is reported here, and the recent history of monthly readings is here. Unadjusted GHCN is normally used, but if you click the TempLS button there, it will show data with adjusted, and also with different integration methods. There is an interactive graph using 1981-2010 base period here which you can use to show different periods, or compare with other indices. There is a general guide to TempLS here.
The reporting cycle starts with a report of the daily reanalysis index on about the 4th of the month. The next post is this, the TempLS report, usually about the 8th. Then when the GISS result comes out, usually about the 15th, I discuss it and compare with TempLS. The TempLS graph uses a spherical harmonics to the TempLS mesh residuals; the residuals are displayed more directly using a triangular grid in a better resolved WebGL plot here.
A list of earlier monthly reports of each series in date order is here:


0 comments:
Post a Comment