Since June 2011 I've been posting monthly TempLS global averages, before the other surface indices appear. The purpose of this haste is partly to see how well it performs in comparison, uninfluenced by "peeking". Here is a recent monthly comparison, with links to earlier months. I post the data here.
So it's now time for a review on how well TempLS tracks. Along the way, I found some interesting results on how the main indices track each other.
Data plot
The data sources are:HADCrut 4
Gistemp Land/Ocean
NOAA Global Land Ocean
RSS MSU Lower Troposphere
UAH Lower Troposphere
and TempLS. The data is tabulated here
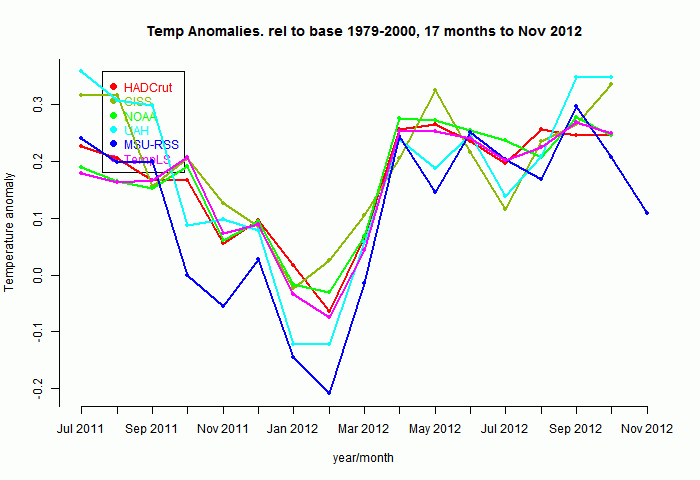
So here's a plot of the indices for those 17 months, set to a common anomaly base period of 1979-2000. Generally the surface-based (non-satellite) follow each other pretty closely:
Now to show more detail of the differences, I'll plot the monthly differences between TempLS and the others. I'll arbitrarily zero the plots in a staggered way to make a point:
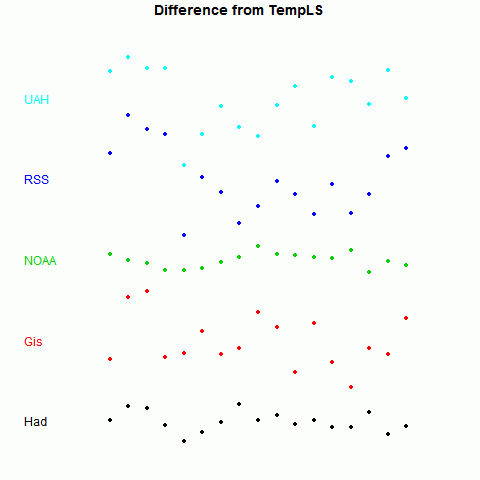
Now it becomes clearer. TempLS tracks NOAA very well, HADCrut 4 a little less, GISS less again, and the lower troposphere indices rather poorly.
There is, of course, a good reason for this. TempLS and NOAA use very similar datasets - GHCN land data, and ERSST. TempLS uses unadjusted GHCN, but there is very little adjustment in this time frame.
Quantification
I wanted to see also how the other indices track each other, and to give a statistically testable measure. An obvious one is just the standard deviation of the scatter seen in the figure above. Here is a table of that measure for each pairing:Standard Deviations of differences (°C)
| Had | Gis | NOAA | RSS | UAH | TLS | |
| Had | 0 | 0.0579 | 0.0274 | 0.0836 | 0.0721 | 0.0248 |
| Gis | 0.0579 | 0 | 0.0692 | 0.0825 | 0.1017 | 0.0653 |
| NOAA | 0.0274 | 0.0692 | 0 | 0.0925 | 0.0756 | 0.0183 |
| RSS | 0.0836 | 0.0825 | 0.0925 | 0 | 0.0561 | 0.0867 |
| UAH | 0.0721 | 0.1017 | 0.0756 | 0.0561 | 0 | 0.0754 |
| TLS | 0.0248 | 0.0653 | 0.0183 | 0.0867 | 0.0754 | 0 |
The differences are marked - 0.0183°C for NOAA vs 0.0653°C for GISS, relative to TempLS.
Another measure is the correlation coefficient ρ for the monthly changes. This has the advantage that it can be easily tested for significance, with the formula for t-value:
t = ρsqrt((n-2)/(1-ρ*ρ))
where n is number of months. As usual, t is significantly above zero at 95% confidence if it exceeds 1.96. Actually, the significance is diminished by autocorrelation etc. Still, in cases of interest it clears that level by a wide margin.
Correlation coefficients of monthly changes
| t-value of monthly changes
|
The correlation of TempLS with all the indices is significantly positive, although with GISS barely so, over this period
Here's a graphical representation of the correlation. The circle areas are proportional to the t-value of the pairing. Big means close tracking. In fact, the area is proportional to ρ*sqrt(1/(1-ρ*ρ)); there's no difference for one plot, but it means that when I compare to different periods, the circles do not inflate with the longer period.
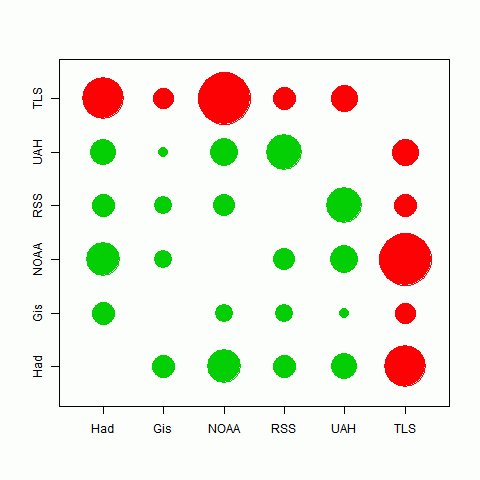
The best correlations are in fact between TempLS and HADCrut and NOAA, which likely indicates the commonality of their data sources. There is also quite good tracking between the satellite indices. It seems that the different methods used have less effect than the different data sets.
Longer periods
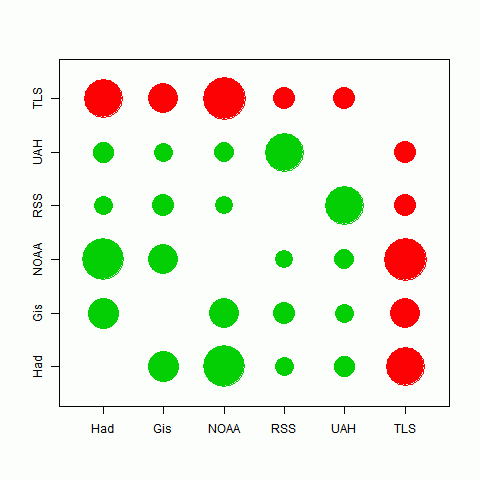
I looked at the 17 months for which TempLS made predictions. But comparisons between other indices are valid beyond that period. As indeed are comparisons with TempLS, because in calculating the monthly values I actually didn't peek.The story is very similar. All the correlations are now highly significant. I'll just show below the circle plot for periods of five and ten years:
| Correlations over 5 years | Correlations over 10 years |
 |
Conclusions
There are interesting patterns of correlation between the various temperature indices. Those using similar datasets correlate very well. GISS, which uses a more diverse set, behaves rather differently.TempLS fits very well into the NOAA/HADCrut grouping.


OK, I was surprised. I expected from your global coverage you'd be closer the GISTEMP.
ReplyDeleteHowever, I have a thought. Are you including the see ice readings in the ERSST data? (They're always set to -1.80)
GISTEMP assumes these are unobserved and extrapolates them from the nearest land station. That might be the principal difference. There's a philosophical question about what you want to measure there - air over sea ice is more like air over land ice than air over sea. On the other hand if you treat it that way then the global 'land-cover' varies by season! GISTEMP finesses the question by always extrapolating land temps into unmeasured ocean cells. My version is a little more subtle, extrapolating both the land and ocean temps before optionally filling in either direction. But if we accept the ice-as-land proposition it would be more rigorous to actually do that rather than arbitrarily extending from land to ocean.
I tried to tackle this problem with a clever joint-kriging algorithm in which land and ocean data were kriged separately in the same matrix with weaker cross terms between the land and ocean blocks. I eventually abandoned it because the hold-out stats weren't compelling, and also because the mathematical cleverness doesn't really address the physical question.
Kevin C
Kevin,
ReplyDeleteI also treat the -1.8 readings as NA - non-existent. I don't think they are a measure of climate. I don't extrapolate, which may be the difference. Because I am in effect doing months in isolation, I don't think there is a seasonal issue. There is a bit of bias in that cells which sometimes freeze in a given month and sometimes not will return readings in warn years and not cold. But using the -1.8 would make that worse.