Thursday, January 2, 2014

Just 60 global stations - area weighting shown with GL graphics.


Twice before I've written about using just 60 met stations to estimate the Earth's global temperature anomaly. The first time I simply chose 61 stations according to "quality" criteria (rural, 90 years records). The resulting average was quite close to HADCRUt land only and the GISS met stations index. This was somewhat surprising, because the stations were in effect not area-weighted, but sin(latitude) weighted.

Then I wrote about trying to get proper area weighting using triangular meshing. In doing that, I used sequential meshes to try to get more even distribution. That post came just before my recent interest in better graphics, and I could not then present the mesh results properly. I can now. The temperature analysis there still stands, and is not developed in this post, but hopefully soon.

It is worth reviewing the motivation. The first post was a response to a challenge by Eric Santer, who thought that 60 stations should be enough for a good global average. I thought so too, but there is more to it. I'm in fact doing a version of the GISS Met stations only index, which is different from land-only in that the stations are weighted by global surface area, so ocean areas are represented by land stations. Compared with land/ocean, which uses SST, this has the plus that it measures the same thing everywhere (air temp 1.5 m above surface), and the met stations have a rich and explicit history. The minus is that the data for ocean areas is far sparser than SST.

When a large area (oceans) is sparsely covered, there is little benefit to the average in having part of the land area densely covered. It makes sense to select a subset of stations, trading density for quality. If the subset can be reduced to 60, say, then the individual stations can be more closely scrutinised. "Quality" here is a combination of long records and apparent freedom from biases like UHI (rural stations).

We want stations of quality that are also fairly evenly distributed - ie have approx equal area weighting. This post does that by compromising initially on quality to get a larger subset, and then in several steps remeshing, eliminating stations of least weight. This is shown by a display of the area attributed to each station at each stage of reduction. The display is in WebGL, which means you can rotate the Earth track-ball style. It also shows a histogram of weights, and lets you click to see the station names.


The plot

Initially, 622 stations are shown. These are GHCN stations classified rural, with at least 50 years of record continuing to at least 2010. Then at each of six stages, the bottom third of area weighted stations are removed, and the remainder remeshed. The radio buttons show the result.

The area assigned to each station is formed by connecting the circumcentres of each of the mesh triangles. Each area is the set of points where that station is the nearest node. See below for some details here. The plot shows the area and the station with a purple triangle. You can click near this to show the station name top left. Bottom right is a histogram of the area weights.

Update - there is a glitch. There are two plots below, and only one can be active (for trackball etc) at a time. That is determined by which was last selected (by radio button).



Quality specs
Rural
at least 50 years
Some data since 2009
Number stations
622
422
286
194
132
89
60


Details

The circumcentres are not exactly the plane centres, because they are projected onto the sphere. The lines are made of two sections, with the midpoint apso projected onto the sphere. This makes them a little more like great circles.

In fact the weight is not quite area. It is for each triangle the volume of the tetrahedron formed by the triangle and earth centre. This is area (triangle) times height, which is very close to the earth radius.

You might expect the areas under the histograms to be much the same, while they seem to increase with subdivision. The reason is that the y-axis varies, but I wanted to keep the same plot size and the same x-axis.

Clicking to show station names only works for the plot where you last clicked a radio button.

Alternatives

A merit of this approach is that a small change can generate a substantially different mesh. So one can test how much the average depends on the specific mesh. That's the next project.

In the plot below, I specify a higher quality spec (70 years of data). That means fewer stages of subdivision, so the penalty is less even weighting. The initial disparity is such that the subdivision only affects part of the Earth, as you can see.


Quality specs
Rural
at least 70 years
Some data since 2009
Number stations
404
278
188
129
88
60


Tuesday, December 31, 2013

November GISS Temp up by 0.17°C


This post is late because, as I mentioned in my last post, I've been travelling. So it isn't breaking news. GISS LOTI went from 0.60°C in October to 0.77°C in November. This is almost exactly the same as the TempLS rise. But GISS had been more volatile in earlier months.

The November reading attracted interest as being the warmest November on record. And pushback on the basis that, well, uncovered steam pipes in Russia etc. These rationalizations never explain why the steam pipes did not equally affect previous Novembers.

Still, GISS and TempLS agree that Russia was indeed the hot spot. Here is the GISS map for Oct 2013:


And here, with the same scale and color scheme, is the earlier TempLS map:


Previous Months


October
September
August
July
June
May
April
March
February
January
December 2012
November
October
September
August
July
June
May
April
March
February
January
December 2011
November
October
September
August 2011

More data and plots


Tuesday, December 10, 2013

TempLS global temp up 0.16°C in November


After months of nothing much, TempLS showed a rise in November, from 0.494°C (Oct) to 0.658°C. By contrast, satellite indices went down.

Here is the spherical harmonics plot of the temperature distribution:


Russia was the hot spot, with N America, esp W Canada, quite cold.

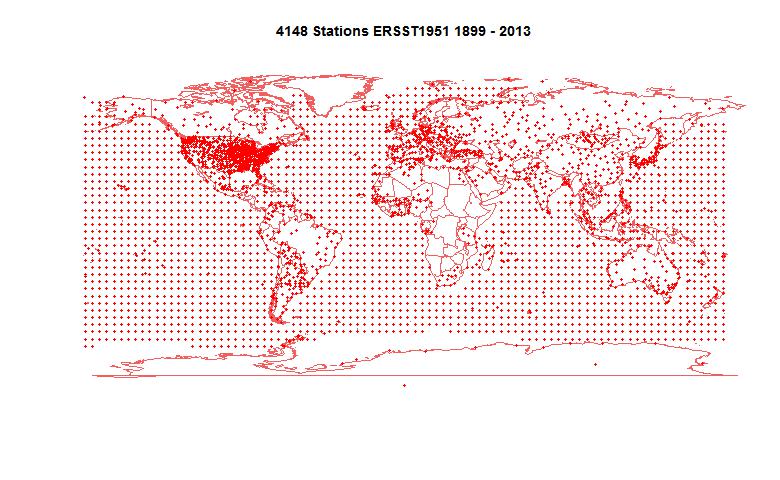
Here is the map of the 4148 (more than usual) stations reporting:


I will be quite busy over Christmas, so light blogging. I'll report on GISS if it comes soon.

Wednesday, November 20, 2013

Pausebusting NOAA


In previous posts here, here and here, I have been discussing issues in infilling cells in the HADCRUT 4 dataset, following a new much-discussed paper by Kevin Cowtan and Robert Way in QJRoyMetSoc. They used satellite data and kriging to extend the data; I looked at a much simpler approach of infilling with latitude averages from the same data (rather than the implicit infilling with global average). I found that it gave rather similar results, although with more limited effect.

Now I want to try it with the similar NOAA gridded data set which is used for their index. They give a detailed description at this download site. It is a similar 5°x5° grid, so the same analysis should work.

I show below first plots of both HADCRUT 4 and NOAA coverage. NOAA has greatly fewer gaps, but also fairly extensive omissions near the poles. Then I show the latitude breakdowns, with seasons. I have included the C&W and UAH plots for comparison.

Coverage plots

This is an active plot - you can choose dataset and view. It counts data in each cell/month from 1979 to 2012. Red is for no data, cyan is complete, and there is shading for intermittent data.


NOAA N
NOAA S
HAD 4 N
HAD 4 S

NOAA coverage is more extensive than HADCRUT, with some odd inclusions (eg central Greenland) and omissions (S Pole). Still, I found using the latitude average method described in previous posts with smoothing parameter r=0.1, that I had to include an extra level of bands to get enough data for lat 85-90S.

Latitude average trends

This is a similar active plot to the one in the previous post. NOAA data replaces HADCRUT 4, and I have increased the width of those curves, since they are new. UAH and the C&W hybrid HADCRUT 4 result are included for comparison.


Annual
DJF
MAM
JJA
SON

(Update - again I made an error with latitude sign (the problem is that HADCRUT orders from N Pole, NOAA from S) So NOAA were reversed, Fixed now.)
The background stripes indicate the latitude bands; N pole is on the right. There's a faint red vertical marking multiples of 30°. In the centre is a little figure showing the global totals, on the same scale.

Here is a table of the global trends, 1997-2012 in C/decade:


SeasonNOAANOAA AvHADCRUT 4HAD 4 Lat AvUAHC&W Hybrid
DJF-0.0519-0.0049-0.04890.00970.02760.0536
MAM0.06880.11230.0660.10190.06390.1276
JJA0.06290.07890.08920.09660.120.1187
SON0.10840.13470.10810.12770.15750.1688
Annual0.04850.08140.05390.08440.09360.1187

The results of NOAA and HADCRUT 4 are very similar, in effect on trend and in seasonal variation. Both show a substantial trend increase in trend over this period, as a result of simply using the appropriate latitude average to infill rather than the global.


Tuesday, November 19, 2013

Seasonal trends for infilled HADCRUT


I have been posting on ways of dealing with cells in the HADCRUT 4 surface temperature anomaly grid which have no data. This follows a new much-discussed paper by Kevin Cowtan and Robert Way in QJRoyMetSoc. They used satellite data and kriging to extend the data, particularly into polar regions. The result that created particular interest concerned trends in a recent period, 1997-2012, which has been characterised as a "pause", partly because HADCRUT showed little trend. C&W found that the trend was significantly greater with this extra care.

I have been discussing this, in posts here and here. In the second post, I showed that simply infilling missing cells each month with the average for the latitude band, rather than implicitly by the global average (the effect of omission) also gave a substantially greater trend over this period.

Interest has been expressed in the seasonal nature of this change. The Arctic amplification is expected to be predominantly a winter effect (Serreze). So here are plots of the various infills (None, my lat av, C&W and also UAH for comparison) over the four seasons, and annually. I have taken William Connolley's suggestion of plotting against sin latitude to avoid overemphasising the polar bands (Mercator-style).


Here is the plot. It's an active plot - you can choose your season. The "HAD4 Lat" is my infill with latitude band averages, with parameter r=0.1, as described here. The other datasets were introduced and plotted here.


Annual
DJF
MAM
JJA
SON

The background stripes indicate the latitude bands; N pole is on the right. There's a faint red vertical marking multiples of 30°. In the centre is a little figure showing the global totals, on the same scale. DJF etc indicate the seasons by initial of the months.

Here is a table of the global trends, 1997-2012:

SeasonHADCRUT 4HAD 4 Lat AvUAHC&W Hybrid
DJF-0.04890.00970.02760.0536
MAM0.0660.10190.06390.1276
JJA0.08920.09660.120.1187
SON0.10810.12770.15750.1688
Annual0.05390.08440.09360.1187

An interesting aspect is that, while the Arctic does have a marked maximum in NH winter, that is a minimum season of of global trends, and quite markedly so. There is a substantially negative trend in the adjacent N latitudes, from about 40-60°. It is interesting to speculate on whether these are related. The global trend was also negative for this season in the original HADCRUT, but the infilling, particularly with the C&W hybrid, had the greatest effect.

The Antarctic region does not have a marked seasonality in the trend, and nor does any other (they don't have big trends at all).


Monday, November 18, 2013

Coverage, Hadcrut 4 and trends

This post is inspired by the new paper by Kevin Cowtan and Robert Way in QJRoyMetSoc, which I wrote about in my previous post. The key issue that they identified was bias due to lack of coverage in regions that were warming rapidly, specifically near the poles.

HADCRUT gathers temperature anomalies each month in a 5°x 5° lat/lon grid. Where gridcells have no data, they are omitted. As I said then, this is not a neutral decision. Whenever you average over a continuum with fixed divisions and have missing values which you omit, that is equivalent to replacing those points by the average of the data you have. That is often not a good choice, and if there is anyway of better estimating the missing values, it should be used. I did my own analysis of coverage here and here.

C&W use a quite elaborate scheme for deriving those infills, involving satellite data and kriging. I wondered how much could be achieved by a very simple improvement. The main bias is believed to be latitude-based; specifically, that polar regions behave differently to the rest. So I sought to replace the missing cells by a latitude band average rather than global. I'm not using kriging or satellite data.

I think this is useful because the new paper has been greeted as a "pausebuster" because it shows a much less reduced trend in recent years. So I'm focussing on the 16 year global trend since Jan 1997 (to end 2012), also treated in C&W. I think a simple demonstration of the coverage correction would reinforce C&W's much more thorough and elaborate treatment.

Coverage and latitude averages


This image from the C&W site gives an idea of the coverage issue. There is a lot of missing data outside the polar regions, but it is not clear whether that biases the trend. But the polar regions are warming rapidly, and to in effect treat the missing cells as global average does create a bias.

I formed a latitude average for each month for a 5° band using the following weighting rules. Cells in that band with data have weight 1. Cells in adjacent bands have weight r, where r is typically 0.1-0.2. Cells in the band adjacent to that have weight r^2. Others are not used.

The point of this is that where there is good coverage, the average will be close to the band average. But if the central band has few data cells, the adjacent band cells, though downweighted, will be more significant by their numbers, avoiding the high variance that would come from relying on just the few cells in the central band. And if both those bands have few entries, then the third level comes into play. This is really only relevant to the N pole band, where the two bands above 80° are sparse.

I then simply infill missing data for each month with the latitude band average value, and compute trends for the resulting complete set.

I expect the result to vary little with r - this will be shown.

Results

The trend over the period 1997-2012, in °C/decade was:

HAD 4 cited C&W 0.046
HAD 4 with global average infill0.0539
HAD 4 with lat av infill r=0.050.0854
HAD 4 with lat av infill r=0.10.0846
HAD 4 with lat av infill r=0.20.0821
GISS cited by C&W0.080
C&W hybrid0.1187

So this simple infill almost doubles the trend, but does not go as far as the C&W hybrid method. It is, however, close to GISS, which interpolates to avoid missing cells.

The graph by latitude band is


Here is a graph to show the small variations with different r (parameter for spreading estimate of latitude band average)


Conclusion

This shows that the trend is indeed biased by coverage. Using a latitude average estimate to replace missing values is at least as justifiable as the default global average. No special interpolation techniques are used, nor any alternative datasets. The change is substantial, though not as complete as C&W. However, the plot of trend by latitude bands is quite similar to the hybrid method.

October GISS Temp down by 0.13°C

GISS LOTI went from 0.74°C in September to 0.61°C in October. TempLS was fairly steady, satellites mixed.

GISS has been unusual lately among surface indices. You can see it here. While TempLS and NOAA have been fairly steady over the last five months, GISS went down, then up, and is back to where it started.


Here is the GISS map for Oct 2013:

And here, with the same scale and color scheme, is the earlier TempLS map:


Previous Months


September
August
July
June
May
April
March
February
January
December 2012
November
October
September
August
July
June
May
April
March
February
January
December 2011
November
October
September
August 2011

More data and plots