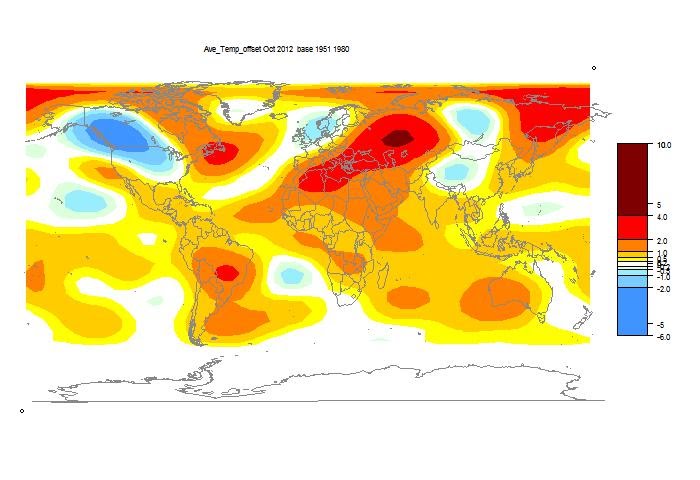
The GISS land/sea monthly anomaly rose from 0.61°C September to 0.69°C in October. This came out just as I posted TempLS, which was unusually early in the month for GISS. Furthermore, GHCN is rather tardy in its posting, so there are fewer stations than usual for the time of the month. TempLS went down by 0.02°C from September. Time series and graphs are shown here
As usual, I compare the previously posted TempLS distribution to the GISS plot.
Here is GISS:

And here is the previous TempLS spherical harmonics plot:

.
Previous Months
SeptemberAugust
July
June
May
April
March
February
January
December 2011
November
October
September
August 2011
More data and plots


You seem to be missing a bunch of southern warming in TempLS - different station selections?
ReplyDeleteArthur,
ReplyDeleteI showed the map of station selections in the previous post. Yes, most of southern Africa is missing, but GISS shows it as cool anyway (and . My southern hotspots aren't as hot as GISS. It could be that GISS is using SCAR data.
Here is GISS 250 km map, where you can see their missing areas. They are fairly similar. I think the reality may be that GISS and TempLS are both fairly early this month, and GHCN is late.
If I get time, I'll do a NH and SH run of TempLS.
Typo - please ignore the "(and". I moved the content to the next para.
Delete