After months of nothing much, TempLS showed a rise in November, from 0.494°C (Oct) to 0.658°C. By contrast, satellite indices went down.
Here is the spherical harmonics plot of the temperature distribution:

Russia was the hot spot, with N America, esp W Canada, quite cold.
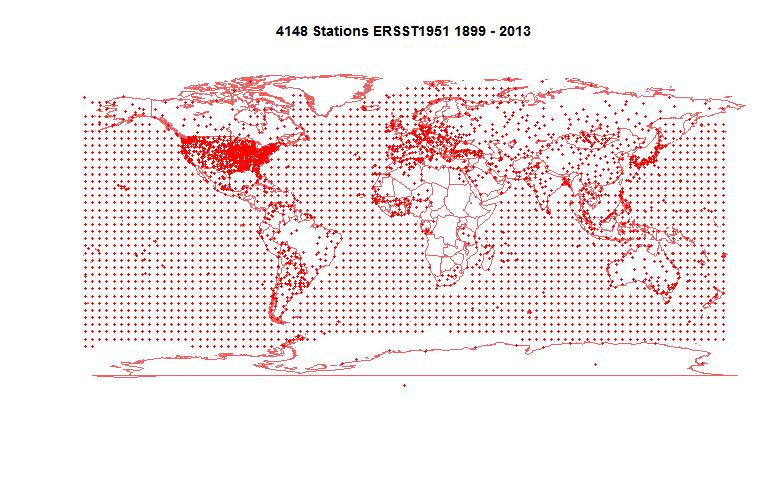
Here is the map of the 4148 (more than usual) stations reporting:
I will be quite busy over Christmas, so light blogging. I'll report on GISS if it comes soon.


I think the term "hot spot" when the temperature in Siberia would have been around -20C is an interesting usage!
ReplyDelete