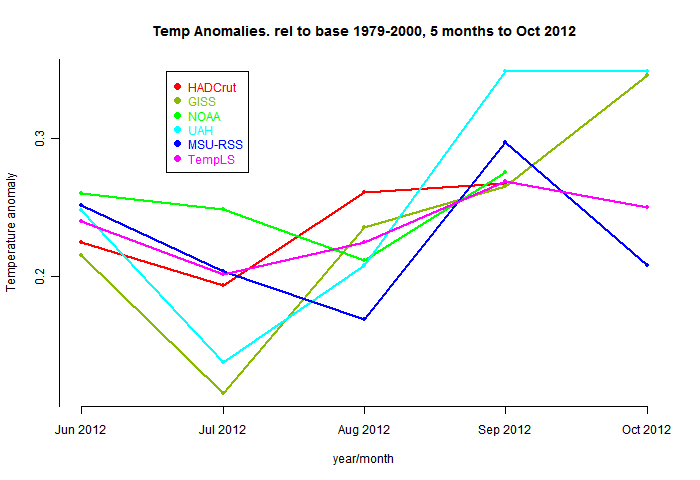
I had been using the GISS index based on V2 of GHCN, but that was discontinued this month. This caused a few days delay as my script, looking at the V2 file, said there was no change. There doesn't seem to be any great discontinuity caused by the change. Of course I'll be using the V3 version in the future.
Below the jump I'll show the comparison of the GISS and TempLS spatial distributions. This month I did another much more detailed spatial distribution based directly on station readings.
Here is the GISS plot of temperature distribution for November 2011:

And here is the TempLS version, using the GISS base years and levels.colors. I use a standard scale, and this is the first time I have overrun - the white patch over the Caucasus. I was reassured to find that GISS also used it's extreme color there. I did the map fairly this month (about 8th) but it still works fairly well.

Previous Months
OctoberSeptember
August
More data and plots


Merry Christmas, Nick
ReplyDeleteThank you for your continuing persistence in counseling commenters toward greater precision in their observations. it would be useful if many of the tempests not confined to their teapots might be put to rest so that we could try to understand the things where there are legitimate questions.
best regards, john ferguson
Thanks, John, and Merry Christmas to you.
ReplyDeleteRegards,
Nick
UAH December is out. Looks to me like the La Nina is anemic.
ReplyDelete