This has significance for talk of a pause in warming. People like to catalogue past periods of zero or negative trend. A senior British politician recently referred to "18 years without warming". That echoes Lord Monckton's persistent posts about MSU-RSS, which does have, of all indices, by far the lowest trends over the period.
Here I want to show results about other indices. Cowtan and Way showed that over this period, the trend in Hadcrut was biased low because of non-coverage of Arctic warming. I believe that TempLS with mesh weighting would also account properly for Arctic trend, and this would be a good way to compare the two, and see the effect of full interpolation. I expected GISS to behave similarly; it does to a limited extent.
So a new active plot is below the jump. You can rotate between datasets and months separately. There is also a swap facility so you can compare the images. And I have individual discussion of interpolation data vs grid data groups.
Here is the main plot. Buttons to rotate months and datasets. Emphasised set is in thicker black, on the legend too. (For some reason, NOAA emphasises as red). There is a reserved group of images for which the swap buttons work. It's initially empty, and you need at least two. In non-swap mode, click push to add the current image. In swap mode, click pop to remove the currently visible from the set.
| Data | Month | Swap |
General comments much as before. There is a big contrast between satellite indices MSU-RSS (long pause) and UAH (short). Trends are rising as the months of 2014 progress. I'm extrapolating to November assuming continuation of current weather, as described in previous posts. Trends are generally rising, which means it is getting harder to find long periods of non-positive trend ("pause").
Interpolation groups
As Cowtan and Way found, whether or not you see a pause depends a lot on whether you account for Arctic warming. TempLS typifies this - the grid version, like HADCRUT, effectively assigns to empty cells (of which Arctic has many) global average behaviour, missing the warming. TempLS mesh has full interpolation, like the kriging version of Cowtan and Way. So here is the comparison plot, with C&W, TempLS and GISS in dark colors: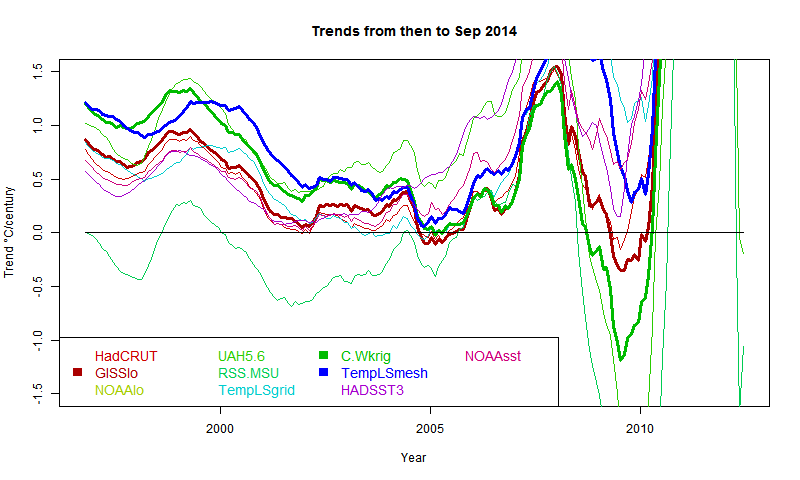
It shows C&W and TempLS tracking fairly closely from 1997 to 2008, with GISS generally a bit below.
Grid surface data
And here for comparison are HADCRUT, NOAA Land/Ocean and TempLS grid. I expect these to be fairly similar. TempLS and NOAA have been very close lately, but over this longer range, TempLS is closer to HADCRUT.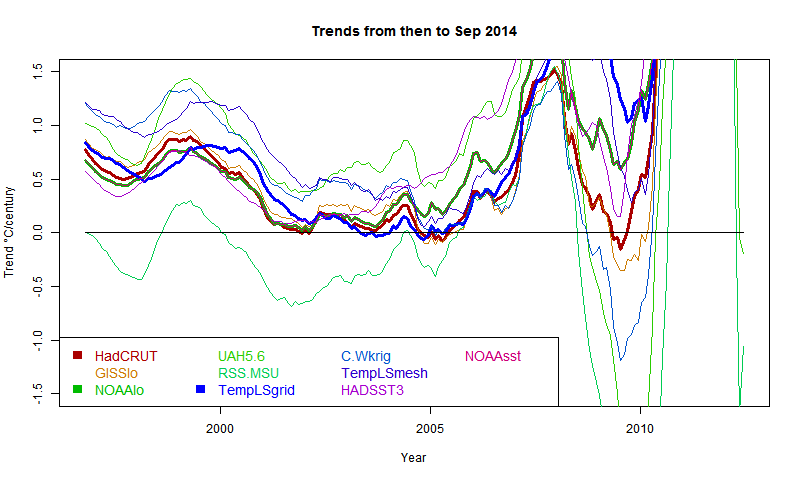
External sources
| HadCRUT 4 land/sea temp anomaly |
| GISS land/sea temp anomaly |
| NOAA land/sea temp anomaly |
| UAH lower trop anomaly |
| RSS-MSU Lower trop anomaly |
| Cowtan/Way Had4 Kriging |
| HADSST3 |
| NOAA sea temp anomaly |


Never mind "Mike's trick" this is clearly Nick's trick to "hide the pause"- no pause regardless of one's choice of starting month. It's time for Anthony to put tricky nicky back in his place with another piece about how Nick "makes us think", while at the same time always being wrong and never being honest to admit he's in the wrong. Maybe another stroke of satirical brilliance from Josh will ensure that he withdraws under a stone never to be seen again.
ReplyDeleteWarning: the foregoing may contain traces of irony.
Correction: I should have said no pause unless one begins in 2010.
ReplyDeleteProbably it's helpful to go look at definitions of the "pause" and work from there.
ReplyDeleteWiki defines the global warming hiatus as a period of a slower rate of increase of the global mean surface temperature (GMST), the globally average land and sea temperature at the bottom of the troposphere.
So the question would be: Is the difference in warming from say 2002-2014 statistically different from say 1990-2001?
For how to do this formally look for instance at the wiki article on segmented regression.
I dislike all this type of statements made on the statistical significance of differences. On this one point I like a comment William Briggs made (very often I do not agree with him). According to that comment the rate of warming should be read from the starting and ending values of the interval considered. Saying that slightly differently the statistical significance of the difference between trends should be calculated based on the accuracy of determining the data values from measurements, not based on the variability or noise in the values, when the noise is due to the phenomenon, not the empirical methods. Data is data, and statistical properties of measured data are statistical properties of the method of determining the values.
DeleteMore meaningful questions on trends require that a model is defined. That model must specify both a set of physical parameters of interest and a noise model for the variability we are not interested in. Only after that can be ask meaningfully, whether the changes in the physical parameters are statistically significant.
We know from experience that what I write above is not empty nitpicking, as opposite answers have been obtained from the same data, when models have been different. Sometimes the model has been specified, sometimes not, which often means that white noise has been assumed for the monthly averages.
" Data is data, and statistical properties of measured data are statistical properties of the method of determining the values."
DeleteThat's a point I've often made. The trend observed is the trend that was, subject to measurement error. The trends within error bars are trends that might have been, on a different but parallel planet. If you could resample from the distribution.
The latter, though, is relevant to whether current trend might continue in the future (a "serial planet").
But people do get them confused. Willis at WUWT said that UAH had shown no trend since 1994, I objected that the trend was, iirc, about 1.4°/Cen. He replied that it wasn't statisticantly different from zero, which is the same thing. I then noted that it was actually not very different from what the models were projecting. So a projection not significantly different from zero can still be as good as a projection can achieve.
I'm sure I don't follow you, Pekka.
DeleteYou need reasonable models for both signal and noise (they can in this case be purely statistical) so that certainly involves better methodology than assuming white noise. It is possible to set down reasonable criteria for what can be considered "reasonable" models.
If the result isn't robust when done properly but starting with different initial assumptions, that's still a meaningful result—it just means the trends aren't different enough for long enough a period of time to truly obtain significance.
Carrick,
DeleteYes, it is possible to specify the parametrization of the model for the signal. That could be linear trend. It's also possible to specify the noise model. Then we can make well defined statistical tests that are considered meaningful by those who accept the models as applicable.
My point was that statements of statistical significance are meaningful only relative to such a model. Often tests are done relative to an obviously very bad model.
"He replied that it wasn't statisticantly different from zero"
DeleteMy post on that is here. If fact it was someone else who made that reply; Willis' reply was slightly different.
Pekka: My point was that statements of statistical significance are meaningful only relative to such a model. Often tests are done relative to an obviously very bad model.
DeleteAgain I don't follow, or at least I don't see the problem.
If somebody proposes a model for the noise, it is easy to test whether this model is viable or not. White noise models obviously fail because real climate noise has persistence in it.
There are always going to be limits to such tests because we only have a short period with usable instrumental data. So, based on different assumptions about the noise, people can devise meaningful statistical tests.
If the results between the methods that meet some minimum quality standards are consistent, we can deem the result as "robust". Otherwise, we can say the data have failed to yield a consistent picture,and that is all we have learned.
I guess put another way, if we give up making significance tests, what is left?
There is very little noise in climate data. For example, the ENSO signal is a forced response to a known input.
Deletehttp://azimuth.mathforge.org/discussion/1504/symbolic-regression-machine-learning-and-enso-time-series/#Comment_12978
In signal processing, "noise" is any variation in the measured signal besides the one you are trying to measure.
Deletewiki entry
So if you're interested in measuring linear trends in global mean temperature, for example, there is obviously a substantial amount of noise.
DeleteYes and we are trying to measure temperature and what do you know, but there is very little noise in that. If we are measuring global temperature and there is an ENSO impact to that, it becomes part of the signal..
DeleteWHT,
DeleteThe 2014 review article of Clarke that you give as a reference to your comment at Azimuth is very nice. It reviews the present understanding of mechanisms of ENSO. It's difficult to see, how what he tells could be taken as compatible with your statement:
the ENSO signal is a forced response to a known input.
and especially when that statement is combined with the claim that there is very little noise in the data.
If what you state were true, all the ENSO scientists were wrong, who tell that the ability of predicting ENSO is still very far from perfect. It takes more than your fits to convince me that you have solved so easily the problem that all those scientists have failed to solve.
I haven't understood is, what you mean by the "known input" in your comment. I have also problems with your use of the word "forced" in that connection. Wind stresses are internal to the Earth system, not a forcing. When two subsystems interact, you might say that one is forcing the other, but that makes really sense only when the forcing subsystem is not influenced much, directly or indirectly, by the subsystem that's being forced. The interaction of the ocean and the atmosphere is, however, very strongly two-way. I do not accept as credible that there's a real characteristic period of 4.2565 years. Rather I continue to think that there's quasi-periodicity on roughly that time scale, but with a lot of variability that's effectively noise.
A major part of the variability of the global temperature is correlated with ENSO, but that does not make the temperature less noisy, that tells only that the noise of ENSO is a major contributor to the noise of GMST.
Pekka, Have you not looked at the regularity of the QBO signal? The periodicity is locked into a 28 month period, and features a jitter around that period that can be well characterized.
DeleteThat is a *known input* to the system because it is *exceedingly" regular. There is limited chaos or noise in the QBO signal. ENSO only appears erratic, but is actually very deterministic.because the inputs are deterministic.
Oh sure you can say that the two, ENSO and QBO, interact, but it is well known that the atmosphere contains most of the variations in the angular momentum based on LOD measurements, and so that turns into a driving force.
I think you should also understand differential equations and what constitutes the LHS and RHS of the equation. The RHS is by definition considered a forcing or stimulation to the equation, and that is how the downward shear of the QBO is impacting the ocean.
So my question to you, which I doubt you can answer, is how can the ocean, which you claim is not deterministic, force a QBO into a nearly periodic regime?
WHT,
DeleteQBO is more regular than most phenomena not bound to the annual cycle. It seems to have dominantly an atmospheric origin related to gravity waves, but from that does not follow that it (or some other atmospheric phenomenon) is a known forcing that drives ENSO. The support for your claim is as weak as before the above comment. If there's something real behind your comment, you haven't explained what it is or shown evidence for that.
You don't like to face the evidence, eh? Calling on first-order physics such as a wave equation driven by the exact QBO time-series as a forcing is incontrovertible as an approach. It is your job to prove that it is not happening. Every volume of liquid has this kind of sloshing response. If the sloshing response was not a modified wave equation, the oceans would not follow conventional physics of liquid volumes.
Deletehttp://ContextEarth.com/2014/10/19/demodulation-and-the-soim/
WHT,
DeleteI said that QBO is happening. Read again my very shot comment.
I really don't understand what you are saying half the time. All I know is that you never seem to attack the garbage being spewed by people like Bob Tisdale and Rob Ellison when it comes to ENSO. Bunch of other denialists such as Bob Carter, William Gray, Judith Curry (and her hubby) can't seem to figure it out either. The mainstreamers such as Kevin Trenberth actually seem to know what they are doing, having been able to demonstrate how to separate the signal from the noise.
DeleteWHT,
DeleteI almost never read Bob Tisdale, I have for long skipped everything Rog Ellison writes. The same applies to many of the others. Climate Etc is so full of total crap that being selective on the reading is the only option. I have ended up arguing persistently against several skeptics, but doing that systematically is not, what I want to do. WUWT I visit only, when someone links to something there that seems to be of interest (that does not happen often).
I have participated in the discussion at Climate Audit on a couple of issues of statistics, but all the discussion on what Mann and others have or have not done seems almost always pointless to me.
Separating the signal from the noise is very difficult in many of the problems of climate science, and even when it seems to have succeeded, it may still be virtually impossible to justify the uncertainty range, as it is often determined based on questionable assumptions. Some of the signals are clear, e.g. the warming signal of last decades, but many others start to appear the less reliable the more I dig into the methods and other details myself.
And almost nothing on that garbage that Curry wrote when she claimed that cloud nucleation proceeded via Bose-Einstein statistics? That was the worst howler I have ever seen -- watching somebody that obviously has never understood quantum mechanics making stuff up. And the rest of her textbook is just as bad.
DeleteClimate Etc only exists as far as I am concerned as a way to find out what the oil-funded denialosphere is trying to hide. And when "smart" clowns like David Young and Tomas Milanovic show up claiming that it is all chaotic and unknowable, you really have to laugh in their faces. The proof is in the pudding when one can model the determinism of ENSO as well as I have shown.
You don't beat the denialists by pointing at unwieldy GCMs -- you beat them by working smart and applying first-order physics and simple models. That is the way it has always been in science.
Nick,
ReplyDeleteTotally of topic. Do you happen to know this http://www.finflo.fi/ I got the impression that you have been working on something similar. I know fairly well the main developer of Finflo.
Pekka,
DeleteNo, I'm a bit out of that now. Over 20 years ago I developed something somewhat similar called Fastflo. It was more of a PDE solver though. Oddly enough, the chief competition at the time was Claes Johnson's group at KTH.
Hi Nick,
DeleteI'd wondered where you got so sharp on meshing. To my mind what you've done makes much more sense that using uniform grids for non-spatially uniform data. Maybe "non-spatially uniform data" isn't quite the right description, and maybe I'm confused about what you are doing.
jf,
ReplyDelete" Maybe "non-spatially uniform data" isn't quite the right description"
Sounds good to me. Yes, one way or another you have to interpolate and integrate. This is the finite element way. It's really the direct analogue of trapezoidal integration in 1 dim.
Nick,
DeleteI agree with the earlier comments that your meshing approach makes sense. Trapezoidal rule is the objectively best choice, when the only thing known about the function being integrated is continuity (i.e. nothing about continuity of the first derivative). The properties of the temperature field are probably close enough to that situation to support the conclusion that your method is the best, when both accuracy and robustness are taken into account. (Defining the finite elements taking into account detailed continental boundaries, might improve slightly on the use of triangular elements but very little in comparison to the extra effort except in cases, where the cell size is large.)
All that applies to the calculation of the average temperature of the globe or of wide areas. Grid based approaches may be favored in presenting spatial information in a form that's easy to use in further analysis. FEM might, however, offer advantages also for many regional studies, and the elements of your mesh might in some cases fit well with those needs.
WHT,
ReplyDeleteDon't make me tell, what I think of that episode.