So the headline is, a very warm month. I think in GISS at least, 2014 may well be a record year. TempLS mesh showed a similar rise; TempLS grid dropped slightly. I expect the mesh version to more closely follow GISS, and the grid version to continue tracking NOAA. My next post will probably be an updated explanation of TempLS.
I've given both TempLS maps below. You can see again that TempLS mesh is closer to GISS than grid.
Comparison of GISS and TempLS, Sun 12 Oct 2014
| Anomaly °C | Apr | May | Jun | Jul | Aug | Sep |
| GISS | 0.71 | 0.78 | 0.61 | 0.52 | 0.69 | 0.77 |
| TempLS mesh | 0.641 | 0.669 | 0.58 | 0.477 | 0.627 | 0.673 |
| TempLS grid | 0.612 | 0.607 | 0.58 | 0.515 | 0.615 | 0.598 |
Here is the GISS map
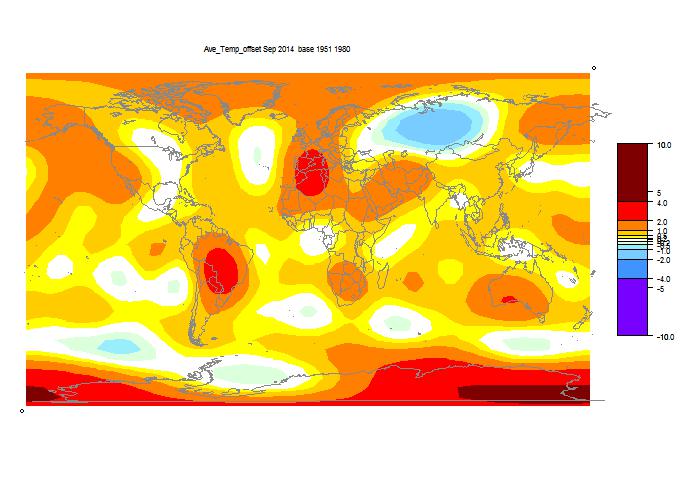
Here is the spherical harmonics based plot, mesh weighting
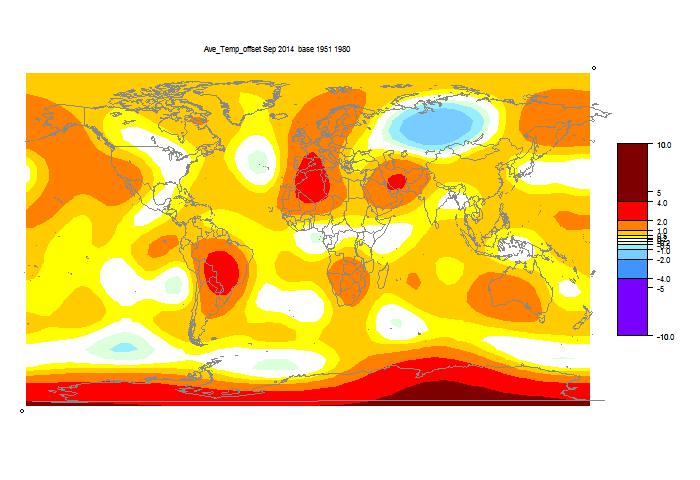
Here is the spherical harmonics based plot, grid weighting
List of past reports


Thanks Nick for keeping up with all of this. John N-G just might get the Nobel Prize.
ReplyDelete