Monday, January 6, 2020

NCEP/NCAR reanalysis up 0.17°C in December.

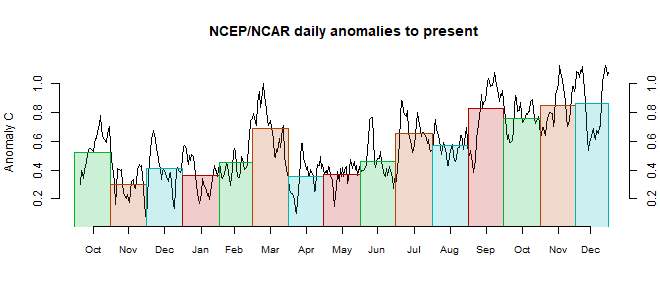
The Moyhu NCEP/NCAR index is disrupted this month because of glitches in the data. This happened at end 2017 too (last year was the US shutdown). What happens is that the last few days stall, and then January results start to appear, without December being finished. In this case the last two days are missing, but I thought I should post, because the TempLS results which should come first are nearly ready. Since end month seems cooler than the rest, I have probably overstated the month average by a little.

Anyway, early December had a spike in warmth, so the index rose from 0.408°C in November to 0.587°C, on a 1994-2013 anomaly base. That makes it the warmest month of the year, just exceeding the earlier peak in March. New data might change that order. I don't usually make long term comparisons because of lack of homogeneity of reanalysis, but 2019 seems to be the second warmest year after 2016.

Europe, west and central Asia were warm, but cool in E China and E Siberia. Australia was famously hot, and there is a big blob of warmth in the Pacific east of NZ. US was warmish, but Canada mostly cold. Antarctica was warm, Arctic mixed.


Tuesday, December 17, 2019

GISS November global steady from October at 1.02°C.

The GISS V4 land/ocean temperature anomaly stayed at 1.02°C in November, same as October. It compared with a 0.063deg;C fall in TempLS V4 mesh (latest figures). GISS also had 2019 as second-warmest November after 2015.

Updating of GHCN V4 this month is fitful, so this figure may change. I see that BEST has delayed publishing November's result.

The overall pattern was similar to that in TempLS. Cool band through Central Asia into Siberia. Warm just about everywhere else, especially Arctic.

As usual here, I will compare the GISS and earlier TempLS plots below the jump.

Saturday, December 14, 2019

November global surface TempLS down 0.063°C from October.

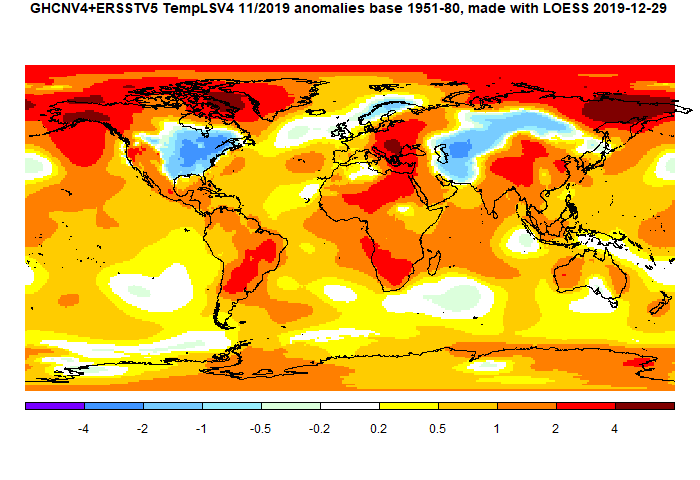
The TempLS mesh anomaly (1961-90 base) was 0.824deg;C in November vs 0.887°C in October. This was similar to the 0.067°C fall in the NCEP/NCAR reanalysis base index. This makes it the second warmest November in the record, after the El Niño 2015. So it almost certain that 2019 will be the second warmest year after 2016 (currently averaging 0.811°C vs 0.855 for 2016). However, so far December has been exceptionally warm, which could bring 2019 even closer.

As I posted yesterday, GHCN data was delayed this month. The file dates posted remained at 6 Dec until just recently, when one dated 12 Dec appeared. It still seems a little lightweight for the date, but it gives me more than my target minimum of 12000 total stations or posting. Actually FWIW waiting didn't make much difference; the earlier file gave an average of 0.828°C.

The pattern echoed features of the recent months. Once again a cold spot in N America, this time east of the Rockies, and also a hot spot over Alaska/NW. This extends to very warm in NE Siberia and the Canadian Arctic islands. Warm in Arctic generally, and a band from E Europe right down through Africa, A cold band in central Asia.

Here is the temperature map, using the LOESS-based map of anomalies.

As always, the 3D globe map gives better detail.

Friday, December 13, 2019

November global surface temperatures delayed.

The usual TempLS calculation of global temperature is awaiting new posting of GHCN V4 surface land data from NOAA. The last update was on 7 December, although even that seemed to be the same as the day before.

The data is currently missing China, Kazakhstan and Mexico. FWIW it shows a drop from October of about 0.06°C. I'll post as soon as new data appears. I usually wait until we have 12000 or more stations (including SST) - currently 10284.


Tuesday, December 3, 2019

November global surface reanalysis down 0.067°C from October.

The Moyhu NCEP/NCAR index fell from 0.475°C in October to 0.408°C in November, on a 1994-2013 anomaly base. That brings it back to about the level of the previous month, but continues the relatively stable warm period since May.

Most of North America was cool, except toward Alaska. far W Europe and most of Russia/Iran also cool. Central Europe was warm, elsewhere mixed. NE Pacific and Greenland were warm.


Saturday, November 23, 2019

A good faith article by a recovering sceptic, but needs care with sources.

There is an interesting article in Reason by Ron Bailey, titled "What Climate Science Tells Us About Temperature Trends" (h/t Judith Curry). It is lukewarmish, but, as it's author notes, that is movement from a more sceptical view. It covers a range of issues.

His history shows up, though, in prominence given to sceptic sources that are not necessarily in such good faith. True, he seems to reach a balance, but needs to be more sceptical of scepticism. An example is this:

"A recent example is the June 2019 claim by geologist Tony Heller, who runs the contrarian website Real Climate Science, that he had identified "yet another round of spectacular data tampering by NASA and NOAA. Cooling the past and warming the present." Heller focused particularly on the adjustments made to NASA Goddard Institute for Space Studies (GISS) global land surface temperature trends. "

He concludes that "Adjustments that overall reduce the amount of warming seen in the past suggest that climatologists are not fiddling with temperature data in order to create or exaggerate global warming" so he wasn't convinced by Heller's case. But as I noted here, that source should be completely rejected. It compares one dataset (a land average) in 2017 with something different (Ts, a land/ocean average based on land data) in 2019 and claims the difference is due to "tampering". Although I raised that at the source, no correction or retraction was ever made, and so it still pollutes the discourse.

A different kind of example is the undue prominence accorded to Christy, and Michaels and Rossiter. He does give the counter arguments, and seems to favor those counters. Since the weighting he gives to those sources probably reflects the orientation of his audience, that may in the end be a good thing, but I hope we will get to a state where these recede to their rightful place.

His conclusion is:
"Continued economic growth and technological progress would surely help future generations to handle many—even most—of the problems caused by climate change. At the same time, the speed and severity at which the earth now appears to be warming makes the wait-and-see approach increasingly risky. Will climate change be apocalyptic? Probably not, but the possibility is not zero. So just how lucky do you feel? Frankly, after reviewing recent scientific evidence, I'm not feeling nearly as lucky as I once did."

Some might see that as still overrating his luck, but it is an article worth reading.


Saturday, November 16, 2019

GISS October global up 0.12°C from September.

The GISS V4 land/ocean temperature anomaly stayed at 1.04°C in October, up from 0.92°C September. It compared with a 0.116deg;C rise in TempLS V4 mesh (latest figures). GISS also had 2019 as second-warmest October after 2015.

The overall pattern was similar to that in TempLS. Prominent cold spot in US W of Mississippi (and adjacent Canada). Warm just about everywhere else (but not Scandinavia).

As usual here, I will compare the GISS and earlier TempLS plots below the jump.