As is apt to happen, there were undercurrents that data is being manipulated for some underhand purpose, and Clive was entertaining the idea that the Pause was being suppressed. Not jumping to conclusions, though, but some were more inclined to. There has indeed been a noticeable increase over those years in the trend during the Pause period. This is overdue, since Cowtan and Way showed in 2013 that HADCRUT's deficiency in Arctic stations was responsible for the difference in Pause trend between theirs and other indices.
Anyway, among dark talk about Hadcrut suppressing the Pause, Paul Matthews commented that GISS had done the same thing, and between 2017 and 2019. This surprised me, because I follow GISS, and compare it with TempLS, and did not know of such changes, which if present would presumably relate to transition from GHCN V3 to V4. Gavin Schmidt has also said that the effect of this was very small.
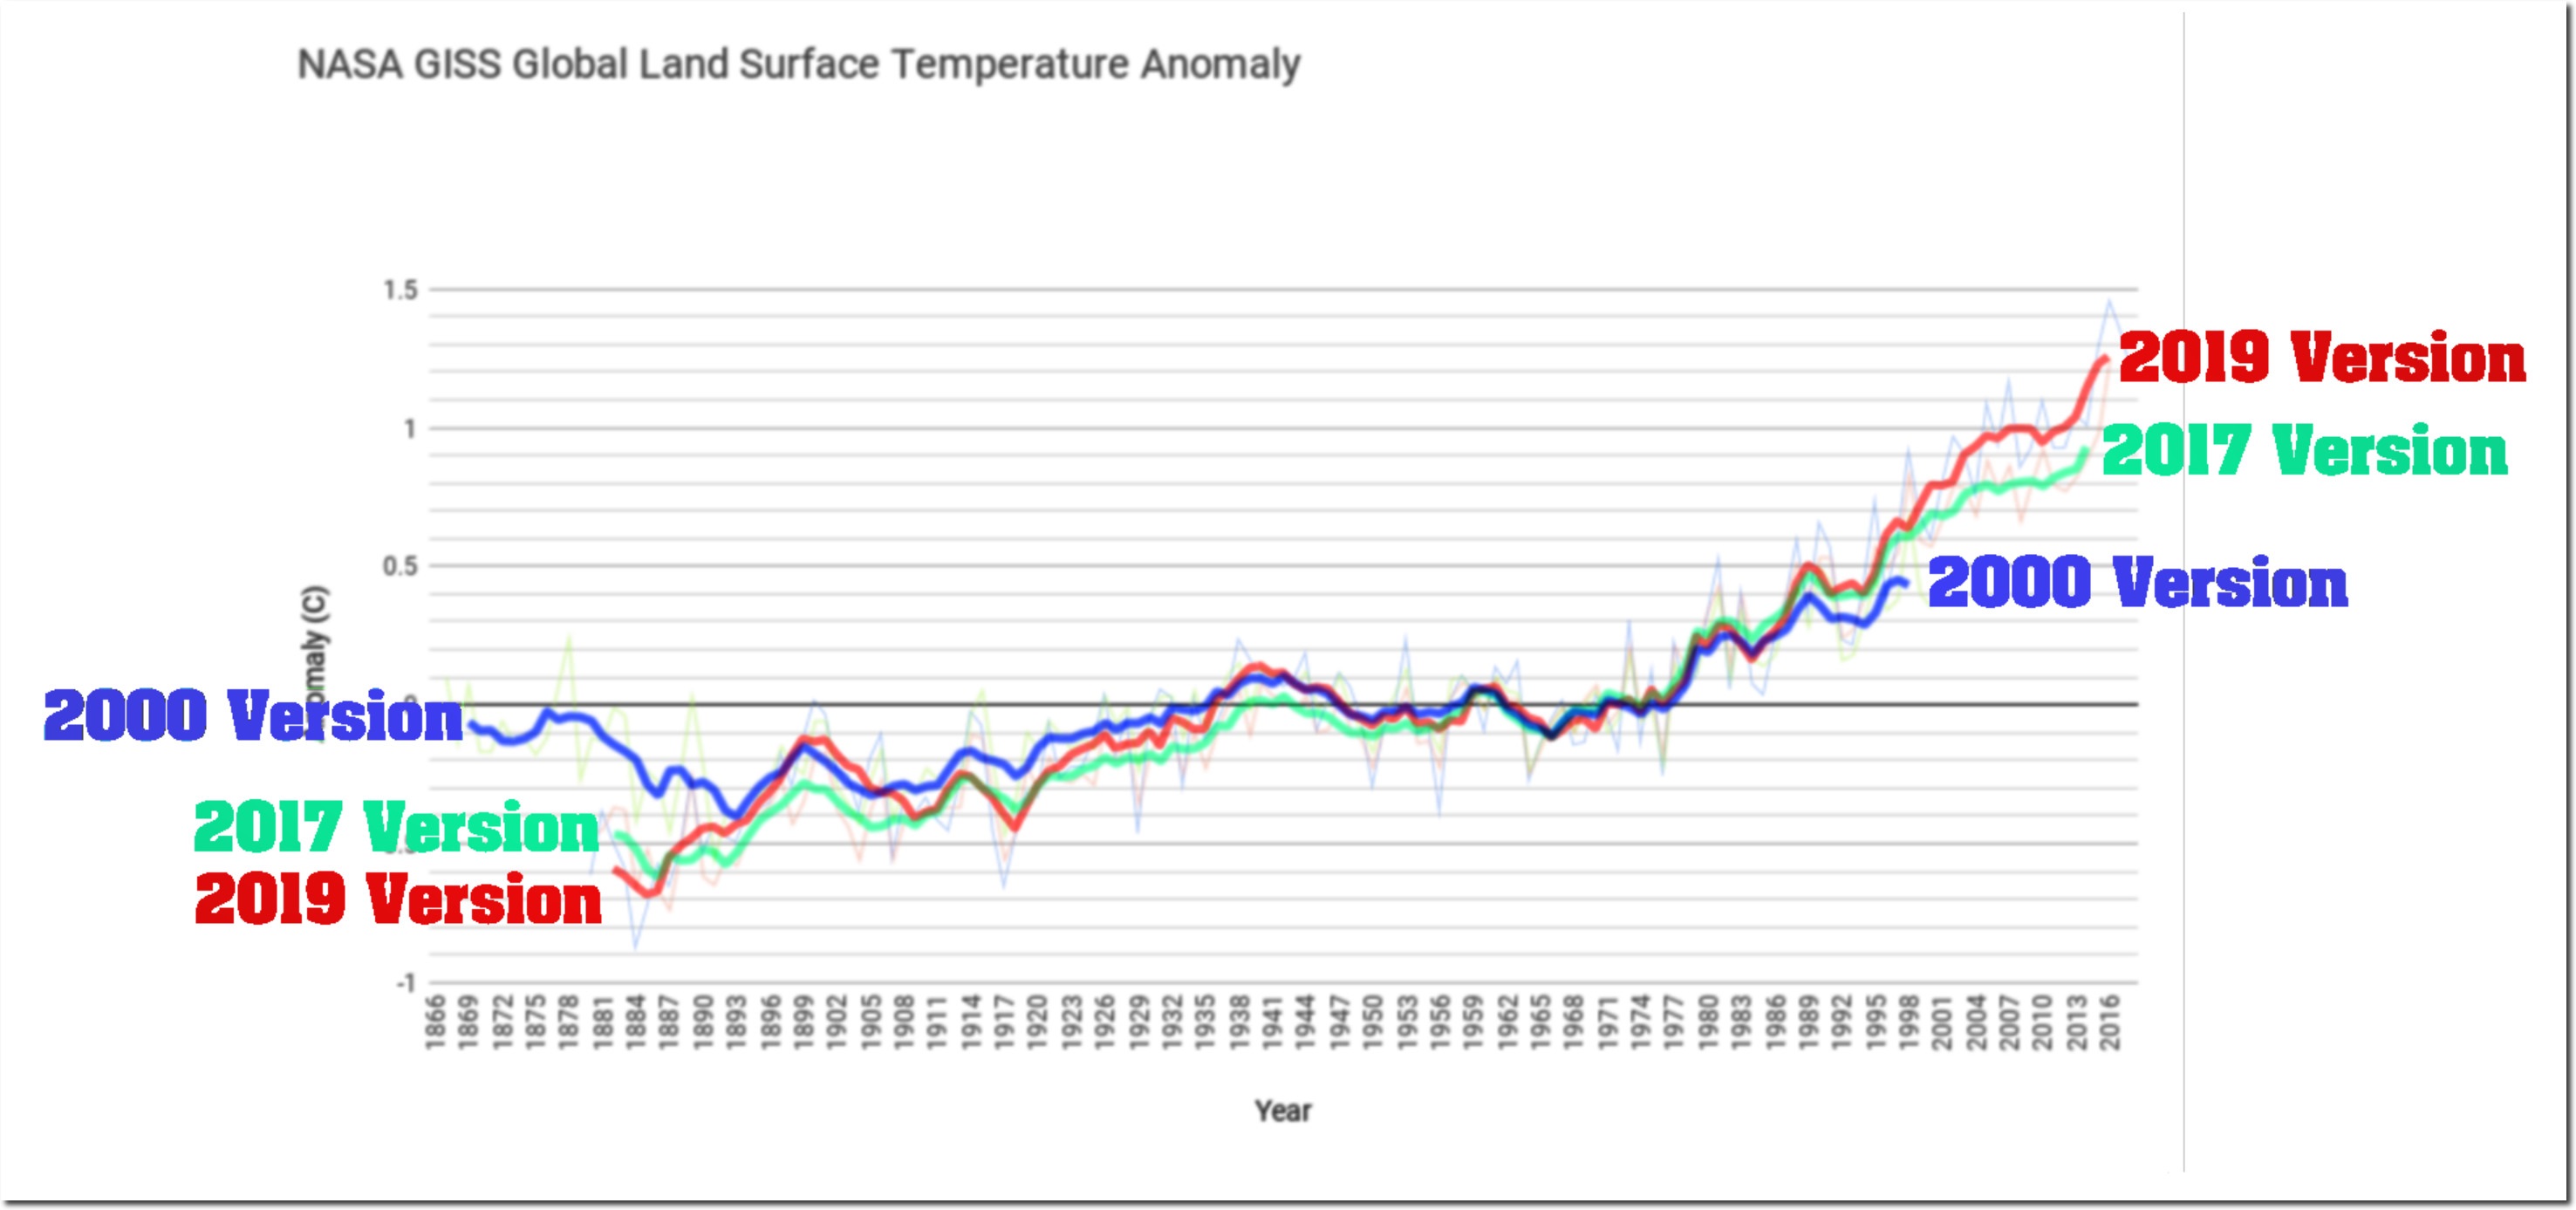
So I followed Paul's link, which led to a Tony Heller post titled "Tampering Past The Tipping Point". It showed the following plot (followed by many more):
And as usual there, the plot and post seem to have circulated widely. You can see a long Twitter listing here of tweets linking to it. So what is it based on?
As often with Heller's posts, it isn't about what most of his audience thinks it is, but they don't seem to worry about fine points. It isn't the GISS land/ocean (LOTI) that gets widely circulated and discussed. The heading says "GISS Global Land Surface anomaly". But GISS doesn't have a Land Surface anomaly index, unlike NOAA or HADCRUT (CRUTEM). So my first thought was that he was plotting the "Met Stations Only" index, Ts. He has done that before, and the years quoted (2000 and 2017) do correspond, more or less, to what is supplied on the GISS History Page (scroll down to where "Met Stations" appears in the headings). I'll digress a little to explain this index.
GISS Ts index
GISS Ts is no longer shown on the main page, although it did have more prominence in V3. Now it is relegated to the History Page, with the introduction:"For historical reasons we also maintain a calculation of the anomalies that would result if one only used the meteorological station data. This estimate is not affected by issues in ocean data processing, but because the land is warming faster than the ocean, it has a larger trend than the land-ocean index that is now our standard product. That too has been remarkably stable over the years:"
And with that, they give, as they do with LOTI, a plot of the data as it had been presented at various stages of GISS history, going back in fact to 1981. You can see both plots of the curves together, and their differences from current. And indeed the differences are small, especially recently.
The "historical reasons" are that, until about 1995, there didn't exist a dataset of sea temperatures of anything like the duration of the land record. So when Hansen and Lebedeff in 1987 published the ancestor of the GISS index, they used whatever station data they could get to estimate surface temperature over the oceans as well as land. Islands had a big role there. This index, called Ts, or GLB.Ts, was their main product until the mid '90's, when it was gradually supplanted by LOTI, using ocean sea surface temperatures (SST) as needed, as they became available backward in time.
Update. As CCE notes in comments, with GISS V4, the Ts index is not only relegated to the History page; it is not calculated in V4 at all. The numbers I have used are the latest V3.
GISS Land
However, Paul insisted that there was a land index, and pointed to the Analysis Graphs and Plots page. If you scroll down to the heading "Annual Mean Temperature Change over Land and over Ocean" and open, it shows a plot of anomalies over land and over ocean, and below it gives links to data.Now this is something different to GISS Ts. It also uses station data, but to estimate the average for land only. All such averages are area-weighted, but here is is just by land area. So from being very heavily weighted, island stations virtually disappear, since they represent little land. And the weighting of coastal stations is much diminished, since they too in Ts were weighted to represent big areas of sea.
The important message here is that Ts and Land are not the same, which I will now show with some graphs. Data is sourced and linked at the bottom.
Recent History, 2017 and 2019
Tony Heller provided a spreadsheet with his post, and it had the GISS data for versions of Ts up to 2017, and the Land data for 2019. I have described details of this here and following. But GISS Ts does of course go to present (May 2019), which is regularly posted here. And you can get past versions of the Land average plots with data on the Wayback Machine - here is version of Jan 2017. So let's look at annual Ts, with 5 year running smoothing:
They are actually very similar. I'll givea combined difference plot later. What about Land?

Not quite as close, but also similar. The main difference is that pre-1900 is warmer in the current version, reducing the trend since 1880 from 1.05 °C/century to 1.0 °C/century. The trend of Ts also reduced slightly. Not much sign of data tampering here! In fact, given the number of extra stations in GHCN V4, there is remarkably little change.
Now I'll plot the Ts and Land averages superimposed on Tony Heller's "tampering" plot. But because the 2017 and 2019 versions are so similar, the plot gets cluttered. To make better use of space, I have truncated some of the big colorful annotations. I'll plot just the 2017 version of Ts and the 2019 version of Land. Not coincidentally, these are the versions of each found in Tony's spreadsheet.

They superimpose exactly! What has been presented as a "tampering" is in fact a plot of two different datasets, representing two different things. To emphasise that, I'll now plot 2019 versions of both Land and Ts:

Also a very good fit. The difference between the red and the green curve isn't "tampering" over time. It's the same difference if you take the current versions. They are just two different datasets representing two different things.
Getting it right.
As mentioned, I originally set this out in comments at Clive Best's site, where Paul Matthews first raised the Tony Heller post. I then noted that at that (Heller's) site, a commenter Genava had observed that the 2019 data plotted was different from the 2019 Ts data, which was the index of the 2001 and 2017 versions. That was on June 27. It got no response until Paul, probably prompted by my mention, said that the 2019 data was current Land data. I don't think he appreciated the difference between Land and Ts, so I commented June 28 to try to explain, as above. Apart from a bit of routine abuse, that is where it stands. No-one seems to want to figure out what is really plotted, and comments have dried up. Meanwhile the Twitter thread castigating "tampering" just continues to grow.Data
The data plotted are year versions of the GISS Ts Met Stations Only index and the GISS annual data for Land Averages. The sources are, in ascii format:GISS T2 current (2019) version
GISS T2 historic, includes 2017 version in zip file
Land average current, csv format
Land Average 2017 wayback version, txt
The data I used are in a .csv file here.


The "historical reasons" are that, until about 1995, there didn't exist a dataset of sea temperatures of anything like the duration of the land record.
ReplyDeleteI don't think that's really true. Jones et al. 1986 introduced a homogenised ocean surface record (apparently combining both SST and MAT data in some way), and combined that with land data to create the first land+ocean global average. Jones et al. 1986 was extensively cited by Hansen and Lebedeff 1987 as a point of comparison, explicitly plotting them together in Figure 15. I think Hansen and Lebedeff just wanted to continue with the basic method introduced in Hansen 1981 as an independent record, and were satisfied, based on the comparison with Jones et al., that their extrapolated land-only method was sufficient. Of course, the subsequent divergence due to the strength of forced warming caused a rethink.
Paul,
DeleteYou're right. I should have qualified to say a regularly maintained dataset, or index, suitable for bringing out a monthly index. I forget some details, but when GISS first brought out LOTI in about 1995, it only went back to 1950, because of lack of SST data earlier. They gradually extended the start date back so that LOTI could replace Ts as the primary product.
I figured that was it, especially since some of the data goes back before 188o
ReplyDeleteHave you contacted Tony Heller and discussed it? He admits when he makes mistakes.
ReplyDeleteI set this out in a comment at his site on 28 June.
DeleteNick, you say:
ReplyDelete"So my first thought was that he was plotting the "Met Stations Only" index, Ts. He has done that before, and the years quoted (2000 and 2017) do correspond, more or less, to what is supplied on the GISS History Page."
If the 2000 version is Ts, that still begs the question why are there substantial differences between the 2000 and 2019 versions that increase the slope, especially in the 1880-1890 and 1985-2000 periods?
Bryan,
DeleteThe differences between 2000 and 2019 are basically the same as the differences between 2000 and 2017 and have been much discussed. They are plotted (actively) on the GISS History page. GISS did very little adjustment until 2001. Then they started doing some homogenisation, and also incorporated the TOBS adjustment for US (which made a noticeable difference globally). Then in 2011/2, they switched to using GHCN homogenisation instead of their own, which also incorporated TOBS (via USHCN). The GHCN adjustments had a greater effect than what GISS had been using. That was the last major change event.
Nick, thanks for the info on the GISS changes.
DeleteNick, what is your opinion on the veracity of the adjustments used by NASA in GISTemp? I don't feel comfortable with them after reading the Karl paper, but I cant articulate why. Tony was instrumental in my awareness of different temp records, but feel events like this with lack of clarification make him less credible. Full disclosure, I definitely am sympathetic to his view. It seems the best way forward is to follow Dr. Spencer's blog that has the satellite info, but it seems no one else wants to do that. Any thoughts would be appreciated.
DeleteMichael,
DeleteIt's good to clarify who is doing what. GISS publishes NOAA station data in a format people seem to like. They show various levels of adjustment, including a very minor UHI adjustment that they make. The rest comes direct from NOAA.
I do believe the NOAA adjustments are the right thing to do. I have written a lot about it; there is a complete listing under the homogenisation button in the Moyhu topic index. Here is a survey of the most clear-cut case, TOBS (for US). Here is a study of the actual difference that it makes to the global average - very little. For my own index, TempLS, I use unadjusted land data. That isn't because I think it is better, but just to emphasise that it gives very similar results.
People often say - well, if it makes no difference, why do it? But scientists don't have a choice. If you believe there is a possible bias, you have to estimate it and allow for it. Usually these effects will cancel, but you don't know until it is done.
As I've also said, correcting for bias replaces it with noise, from the uncertainty of the adjustments. But in large scale averaging, noise isn't a problem. The sheer size of the sample damps it right down, but it won't damp bias. And a systematic procedure like pairwise homogenisation can be tested to see if it is introducing bias. It doesn't.
Nick, I also don't see any difference between the last two graphs other than the labels. Am I missing something?
ReplyDeleteWell, I looked a bit closer and now I see that in the next to last graph the black 2017 Ts line ends in 2017, but in the last graph the black 2019 Ts line continues to 2019. This is consistent with your 2nd graph that shows little difference between the 2017 and 2019 Ts values.
DeleteNotable that in the "Updates to Analysis" page, they write
ReplyDelete"We will no longer provide the legacy global estimates based on surface air temperatures alone, since they are overestimating any changes (heating or cooling) and are often confused with temperatures averaged over the land surface only — actual land surface means are provided in the "Annual Mean Temperature Change over Land and Ocean" section of the graphs web page."
https://data.giss.nasa.gov/gistemp/updates_v4/
That was written June 14th, or 10 days before Heller's post.
Also, you can get the GHCNv4 version of their old "Met Station" analsysis by changing the URL to reflect version 4. i.e.
https://data.giss.nasa.gov/gistemp/tabledata_v4/GLB.Ts.txt
Comparing the two, the rate of warming for recent years has increased slightly, while it has decreased prior to ~1910.
Nice, I'll bookmark that link and see if GISS make "hidden" updates of dTs in the future
DeleteEssentially, dTs is a global index based on zonally averaged land1200km (1200 km met station only map version with gaps infilled by the zonal mean).
I think it's sad that they discontinue dTs. My opinion is that is has less bias compared to the true global 2m SAT, than the blended Gistemp loti.
A while ago I emulated dTs using CMIP5 SAT data ( masking and zonal averaging), and found that the trend 1970-2017 only became 0.008 C/decade higher compared to the complete dataset. On the other hand, land/SST blending of model data like Gistemp loti, reduced the trend by ~0.03 C/ decade.
Thanks, CCE, I'll make a note in the text.
DeleteOlof, I doubt that they will make a "hidden" v4 version of Ts. It would not be easy. And I too am sorry to see it go. I think it was the right metric for evaluating Hansen's prediction. However, it's true that no-one ever linked to it except for sceptics making misdirected mischief.
Hi Nick. The link that I provided really is a v4 version. Whatever changes were needed would have been made when they moved LOTI to GHCNv4, which is all part of the same program (if I remember the description from the "clear climate code" guys). Not sure how long it will be maintained (especially if not publicized) but I would assume that it gets automatically updated whenever they do their monthly update.
DeleteSorry, I see you mean you don't expect future updates.
DeleteNick,
DeleteWhy not? Giss still do most of the job behind dTs. They still produce the Surface air, 1200 km smoothing, subbox grid series:
https://data.giss.nasa.gov/pub/gistemp/SBBX1880.Ts.GHCNv4.1200.gz
The rest is zonal averaging of the data. I think dTs does the zonal averaging in the eight major box zones. However, it's not a bad choice to do the zonal averaging using the finest gridding This is done in the tool "Plots of zonal means":
https://data.giss.nasa.gov/gistemp/zonal_means/index_v4.html
You just have to set "Station data only -1200 km", and then download the dTs-like zonally averaged Global mean series..
Yes, the link provided by cce works, at least for now..
DeleteGiss just updated Gistemp dTs for June, both v4 and v3, together with the other products.
June 2019 was the warmest June ever in dTs, just like in Gistemp loti.
Thanks to cce for the hint on Ts having survived the V3/V4 transition!
ReplyDeleteRegards
J.-P. D. alias Bindidon