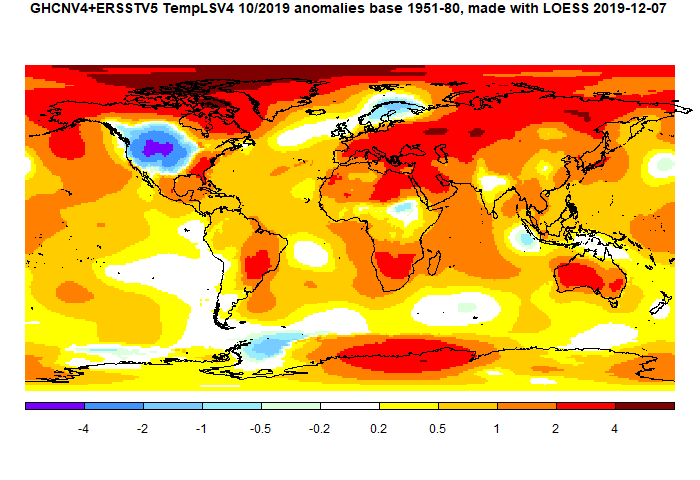
The most noticeable feature was the cold spot in NW US/SW Canada. However, the rest of N America was fairly warm. There was warmth throughout Europe (except Scandinavia), N Africa, Middle East, Siberia and Australia. Sea temperature rose a little.
Here is the temperature map, using the LOESS-based map of anomalies.
As always, the 3D globe map gives better detail.
This post is part of a series that has now run since 2011. The TempLS mesh data is reported here, and the recent history of monthly readings is here. Unadjusted GHCN is normally used, but if you click the TempLS button there, it will show data with adjusted, and also with different integration methods. There is an interactive graph using 1981-2010 base period here which you can use to show different periods, or compare with other indices. There is a general guide to TempLS here.
The reporting cycle starts with a report of the daily reanalysis index on about the 4th of the month. The next post is this, the TempLS report, usually about the 8th. Then when the GISS result comes out, usually about the 15th, I discuss it and compare with TempLS. The TempLS graph uses a spherical harmonics to the TempLS mesh residuals; the residuals are displayed more directly using a triangular grid in a better resolved WebGL plot here.
A list of earlier monthly reports of each series in date order is here:


Well that is total garbage. Where I live is dark orange and we had one of our coldest Octobers ever.
ReplyDeleteWhere do you live?
DeleteCasey Station.
DeleteOK, so actually Casey Station is at the border of the yellow and light-orange zones, so it would be around +0.5 according to the map's legend.
DeleteAlso, BOM doesn't say that Casey had one of its coldest Octobers ever:
"A run of cold weather early in the month ensured Casey was a little cooler than average overall.
Typical of the time of year, the second half of the month was much warmer than the first half at Mawson, Davis and Casey"
My guess is that not all the data from stations in that region have made it into GHCN yet, and as those data arrive the spatial pattern on Nick's map would shift around.
The best way to check on this is to go to the more detailed globe map here. Here is a screenshot. On the globe, you can click on Casey. It tells you that the anomaly for the month was 0.05°C, indeed rather cool, although obviously not even below long term average. But graphically, that gets mixed with Law Dome, nearby, which had an anomaly 0.66°C. Vostok, well to the interior, had an anomaly +3.63. The LOESS graphics put the Casey/Law Dome region just on the yellow/orange border, which would be 0.5°C.
DeleteAnonymous Above thinks the orange/red colors mean monthly warmth in a specific area. He/she can't comprehend that the color variations are based on the temperature difference from the 1951 - 1980 baseline unto now.
DeleteAfter declining over the previous 12 months and dipping firmly into negative territory, East Pacific warm water volume has now clearly turned a corner and has been heading sharply upwards over the past couple of months back into positive territory. Meanwhile the West Pacific has peaked and now appears to be heading negative. This really rules out La Nina this Winter and rules out a La Nina-influenced 2020. Nino3.4 will probably be just negative over Winter though it may depend on how different groups do their baselining, which shows how mildly negative that is.
ReplyDeleteOn this basis I think it makes sense to treat 2020 as very much an ENSO-neutral year, and therefore around a 50:50 chance of a new record high.