I don't know what makes these things recur - but it can be amplified by a gullible journalist, like Graham Lloyd, of the Australian. The classic of these was Willis Eschenbach on Darwin, about which I wrote my first blog post. The issue then was about GHCN V2 adjustments. As I showed there (following Giorgio Gilestro), you could plot distributions of effects of adjustments on trend. There was a fair spread, but the mean effect was 0.17°C/century. A little short of half had a cooling effect. I noted Coonabarrabran as one that was cooled as much as Darwin was warmed.
I did an update here for GHCN V3, and a further breakdown here between US and ROW. US has higher adjustments, mainly because of TOBS.
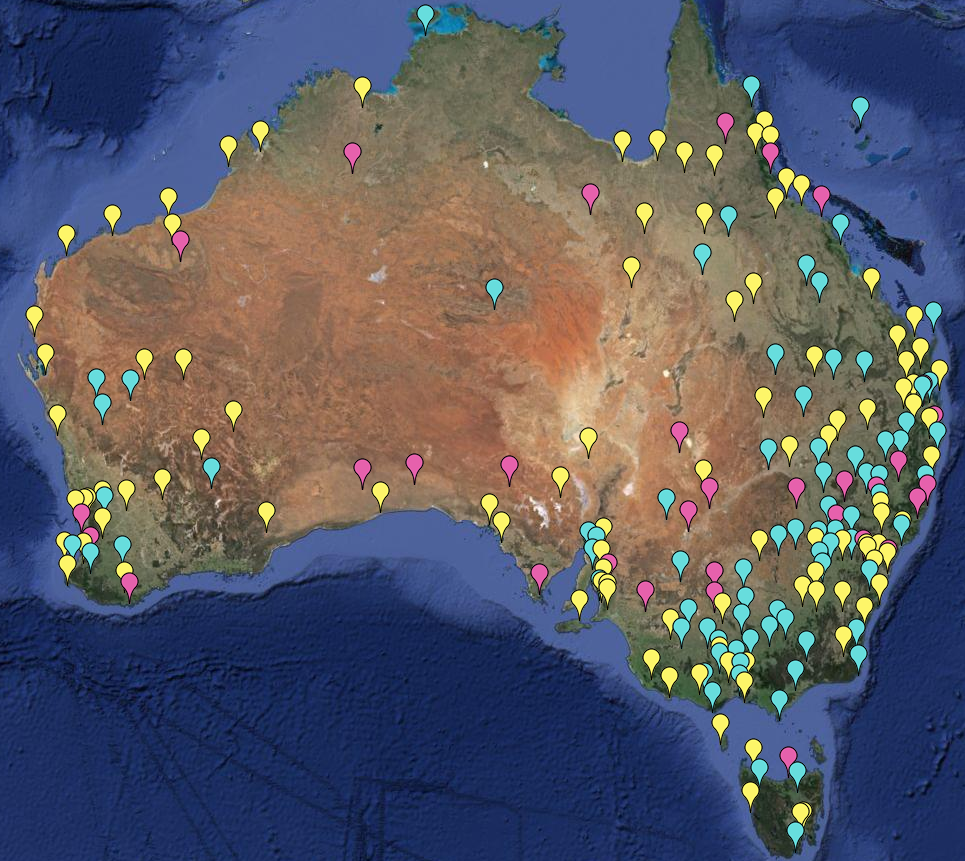
The first link included a gadget using a Google Maps interface that could selectively show stations that were warmed or cooled by adjustment, and by how much. I'll describe it more below the jump, but the original had more complete information. It works for anywhere in the world, but here is an image of Australian GHCN stations with more than 50 years of data. Pink are cooled by GHCN V3 adjustment, cyan warmed, and yellow have no adjustment (strictly, zero trend change):
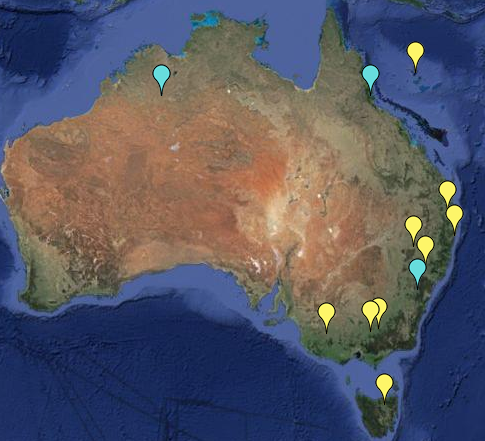
Update: Here is a further plot of the more extreme trend adjustments, magnitude >1 °C/cen. Note that it is for mean temp, not minimum. Amberley still qualifies (1.36°C/cen), but not Rutherglen. Yellow warming; cyan cooling.
The gadget works by "or" logic, which can be tricky. It's better to change than add. To make the pic, I first pressed the Invisible button to start with blank screen. Then I unset the All button, and:
- entered trend change < 0.0001, pressed the radio button for that, and clicked yellow. All stations with zero or cooling are shown.
- Then I change 0.0001 to -0.0001 and click pink. Actual cooling trends turn pink.
- Now I change to > 0.0001 and click cyan. That produces warming trends.
- Finally I limit to 50+ years. I unset the radio button for trend, set it for duration, and set that to <50. Then I press invisible.





 Posts


