I've also wondered the effect of eccentricity. But when you think about anomalies, it is clear that they subtract out any annual cycle. So the effect can't be found there. And in fact it's going to be hard to disentangle it from axis tilt effect. A GCM could of course run alternatively with a circular orbit, which would determine it.
Anyway, someone posted a plot of average daily insolation against time of year and latitude. That is, at TOA, or for an airless Earth. I was surprised that the maximum for the year was at the solstice at the relevant Pole. I found a good plot and the relevant maths in Wikipedia. So I'll show that below the jump, with a brief version of the math, and a plot of variation with latitude at the solstice. It isn't even monotonic.
So here is the plot, with caption also from Wiki.

 , the theoretical daily-average insolation at the top of the atmosphere, where θ is the polar angle of the Earth's orbit, and θ = 0 at the vernal equinox, and θ = 90° at the summer solstice; φ is the latitude of the Earth. The calculation assumed conditions appropriate for 2000 A.D.: a solar constant of S0 = 1367 W m−2, obliquity of ε = 23.4398°, longitude of perihelion of ϖ = 282.895°, eccentricity e = 0.016704. Contour labels (green) are in units of W m−2.
y axis is latitude, x axis is angle of orbit, starting at the March equinox. You can see the effect of orbit eccentricity in making the S pole warmer. That pole also shows clearly the non-monoticity; there is a pinch near the Antarctic circle.
So here is the Wiki math, using the above notation:
Solve

for ho
Solve

for δ
But here I find a vary rare math error in Wiki. The last term should not have an ω. So I removed it.
Now substituting

in

we have the solution.
I used this to plot the solstice curves:
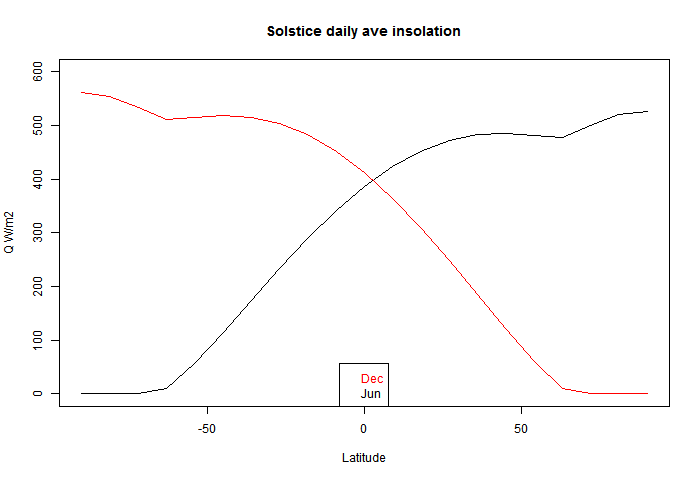
You can see that there is a discontinuity of (2nd - see PP in comments) derivative at the polar circles, where one goes into night, and the other gets the benefit of 24 hr insolation, which is enough to exceed even average daily tropical insolation (of course, without atmospheric losses).


Except you need to multiple by cos(phi) to get the real picture of relative energy flux, because of the greater area of Earth's surface that receives this insolation near the equator relative to the poles.
ReplyDeleteThe solstice profile doesn't tell much about average energy flux anyway - it's just a point in time. I thought the effect that lead to the Pole being a maximum was interesting, and is best shown with latitude on the axis. Sometimes cos(lat) is better.
DeleteYou really shouldn't remove omega from the calculation if you're computing Milankovitch cycles. The position of perihelion w.r.t solstice determines the length of the seasons, which is critical for insolation changes.
ReplyDeleteOr, to put it another way: by removing omega, the x-axis of your graph incorrectly assumes a circular orbit, where all seasons are the same length. But actual annual insolation depends on how the x-axis is expanded and shrunk by the varying speed of the Earth along its orbit.
DeleteI haven't removed ω from the calculation; just from the equation relating declination to day of year. It comes into the next equation, which is the amplitude modulation. It must be wrong because the maximum is at the solstice, not some time related to ellipticity.
DeleteI've just used Wiki's notation, because I wanted to link in their formulae (and graph).
It would also be useful if you switched to standard astronomical notation for symbols, i.e., your Theta is better understood as lambda, the Sun's longitude in the ecliptic reference frame.
ReplyDeleteLooking at the formulas and the curves more accurately seems to tell that the first derivative is not discontinuous at polar circles. The second derivative is discontinuous.
ReplyDeleteThe first derivative of h0 is discontinuous and even diverges on the lower latitude side, but this coefficient of this derivative goes to zero fast enough to make the first derivative of the insolation continuous.
Indeed, thanks. I've corrected. But it certainly changes rapidly.
DeleteYes, not only the first derivative of h0, but also the second derivative of the insolation has a divergence at polar circle on the low latitude side.
Delete