GISS has posted its October estimate for global temperature anomaly. It was 0.76°C, the same as the revised September (had been 0.77°C). TempLS mesh was also almost exactly the same (0.664°C). TempLS grid, which I expect to behave more like HADCRUT and NOAA, rose from 0.592°C to 0.634°C.
The comparison maps are below the jump.
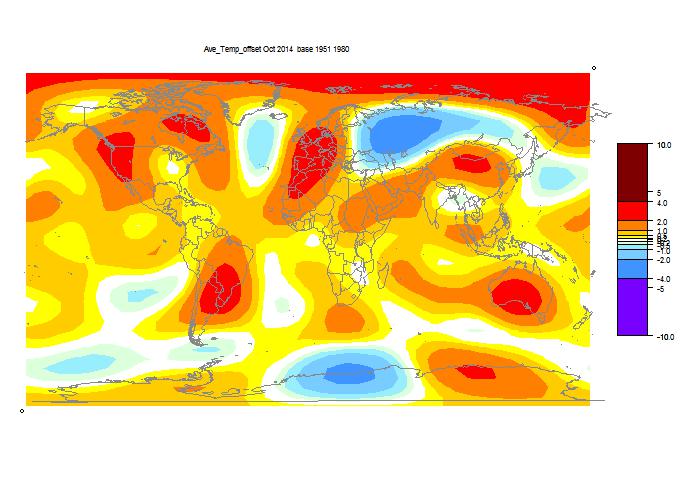
Here is the GISS map:
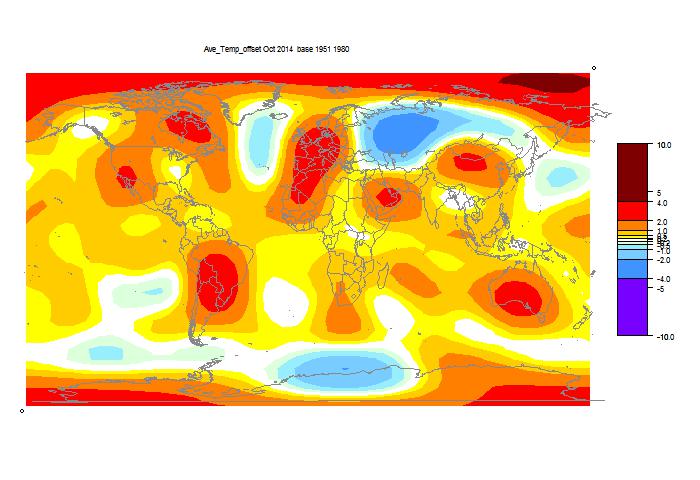
And here, with the same scale and color scheme, is the earlier mesh weighted TempLS map:
And finally, here is the TempLS grid weighting map:
 List of earlier monthly reports
More data and plots
List of earlier monthly reports
More data and plots


0 comments:
Post a Comment