I was commenting on an
interesting post (part of a series) at Clive Best's blog. He's been looking at the differences between Hadcrut 3, of about 2012 vintage, and current Hadcrut 4.6. There are some, and I may blog about that. The most obvious difference is that the number of stations in the inventory has nearly doubled. But Clive was focussing on changes to locations that were common to both. I did some analysis, part reported
here.
As is apt to happen, there were undercurrents that data is being manipulated for some underhand purpose, and Clive was entertaining the idea that the Pause was being suppressed. Not jumping to conclusions, though, but some were more inclined to. There has indeed been a noticeable increase over those years in the trend during the Pause period. This is overdue, since
Cowtan and Way showed in 2013 that HADCRUT's deficiency in Arctic stations was responsible for the difference in Pause trend between theirs and other indices.
Anyway, among dark talk about Hadcrut suppressing the Pause, Paul Matthews
commented that GISS had done the same thing, and between 2017 and 2019. This surprised me, because I follow GISS, and compare it with TempLS, and did not know of such changes, which if present would presumably relate to transition from GHCN V3 to V4. Gavin Schmidt has also said that the effect of this was very small.
So I followed Paul's link, which led to a
Tony Heller post titled
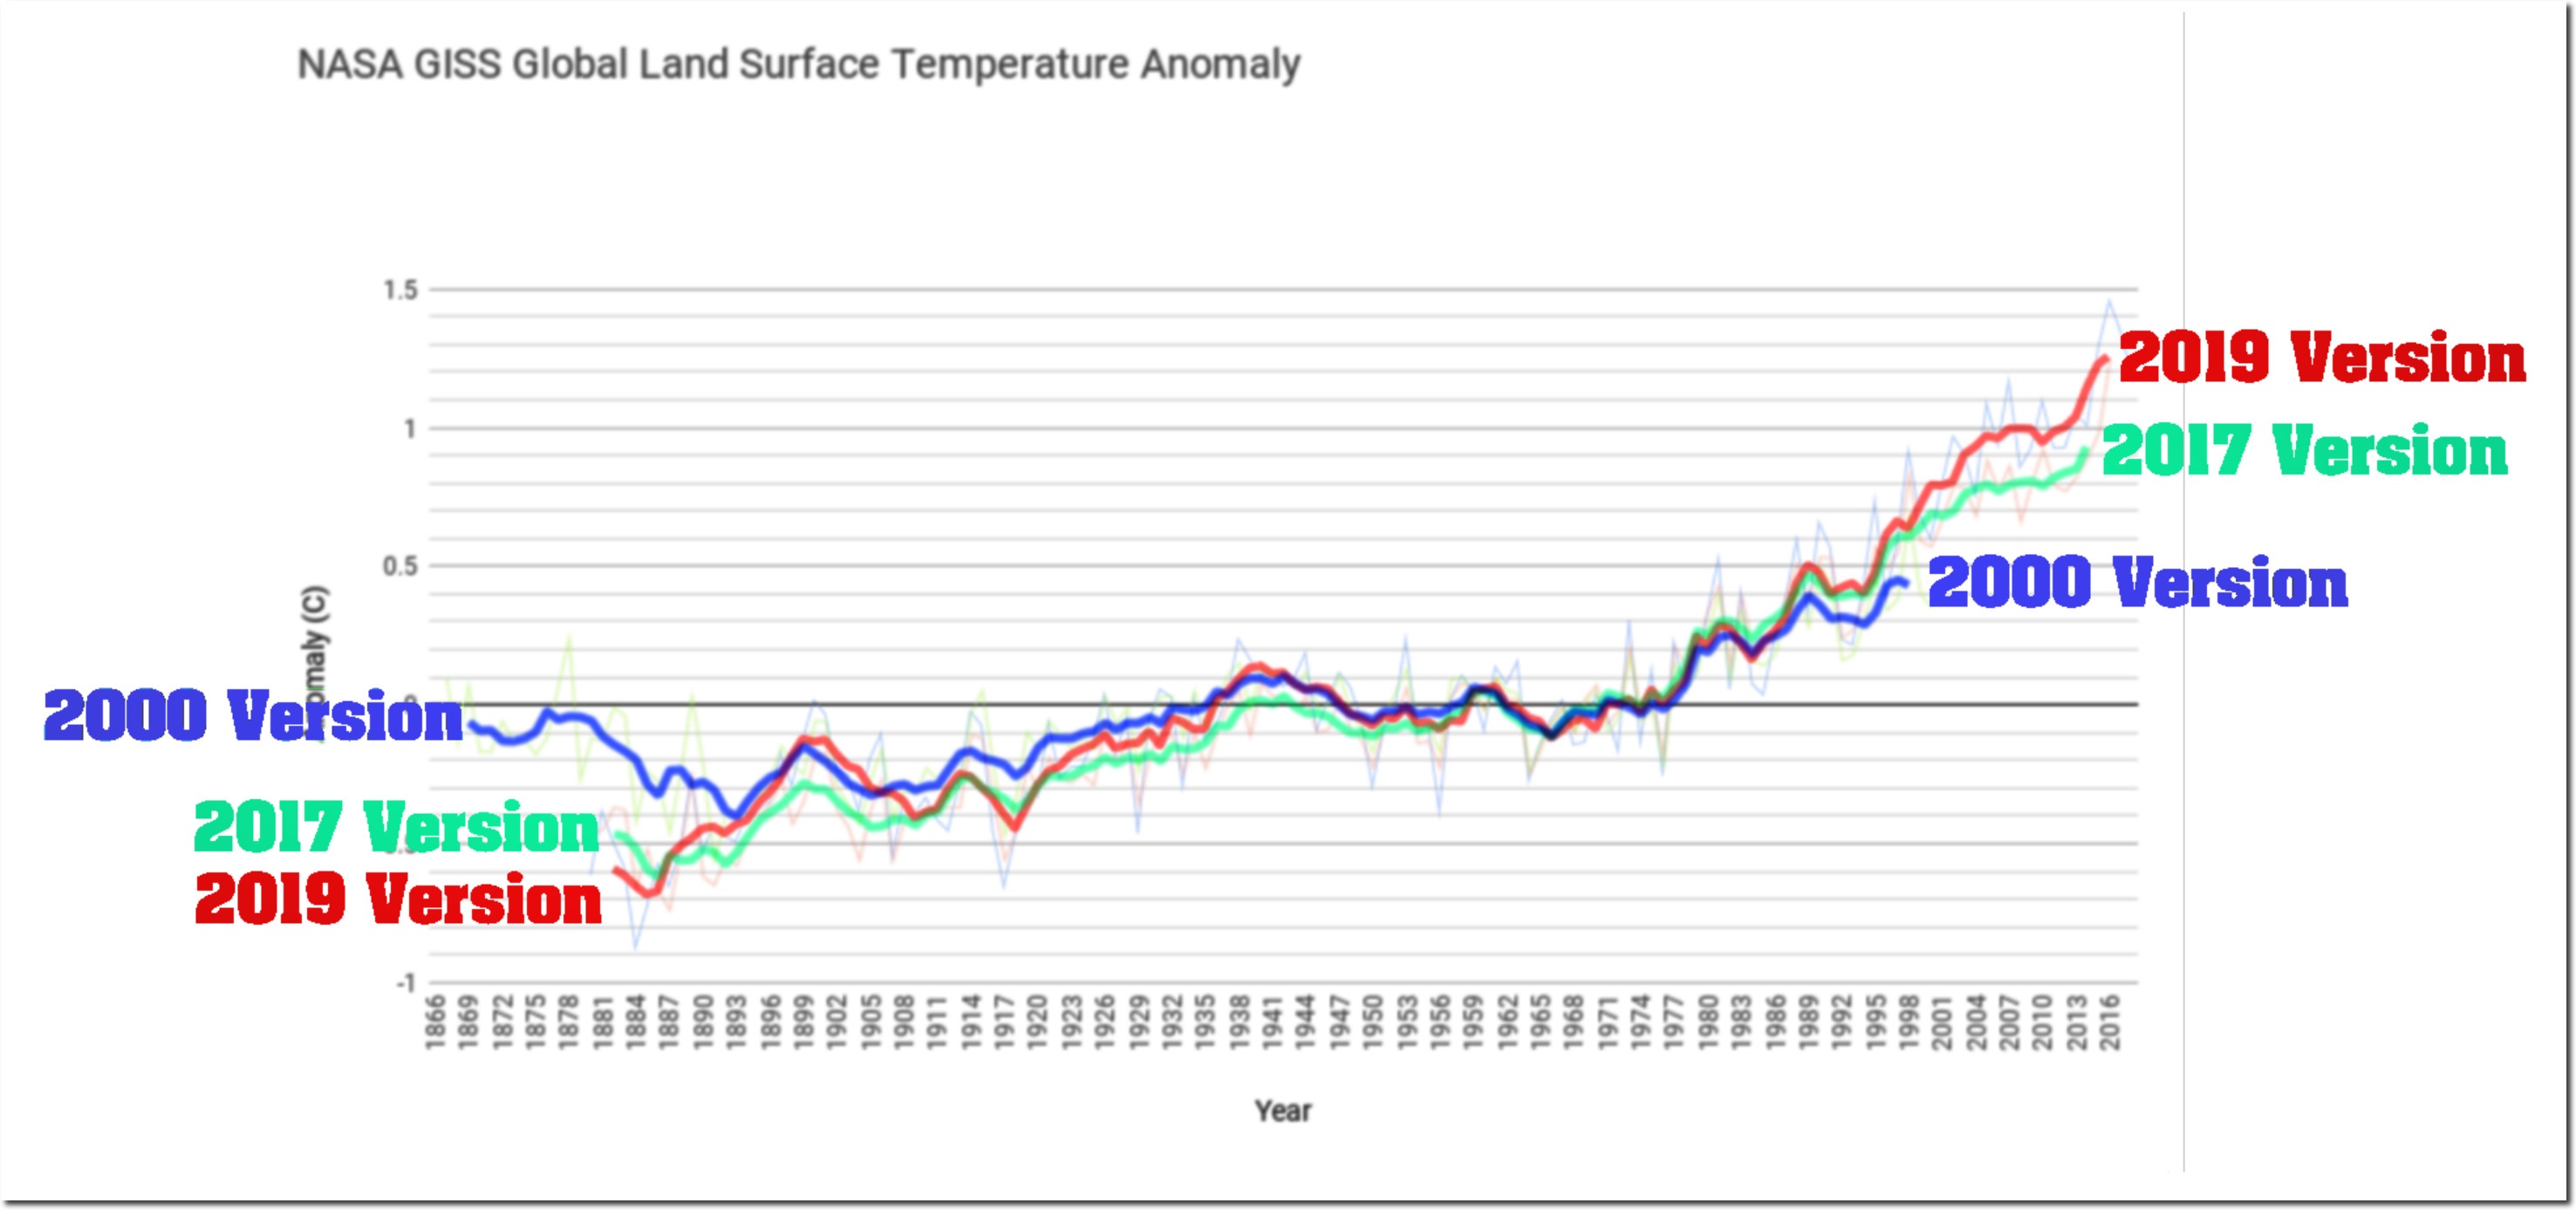
"Tampering Past The Tipping Point". It showed the following plot (followed by many more):
And as usual there, the plot and post seem to have circulated widely. You can see a long Twitter listing
here of tweets linking to it. So what is it based on?
As often with Heller's posts, it isn't about what most of his audience thinks it is, but they don't seem to worry about fine points. It isn't the GISS land/ocean (LOTI) that gets widely circulated and discussed. The heading says "GISS Global Land Surface anomaly". But GISS doesn't have a Land Surface anomaly index, unlike NOAA or HADCRUT (CRUTEM). So my first thought was that he was plotting the "Met Stations Only" index, Ts. He has done that before, and the years quoted (2000 and 2017) do correspond, more or less, to what is supplied on the
GISS History Page (scroll down to where "Met Stations" appears in the headings). I'll digress a little to explain this index.
GISS Ts index
GISS Ts is no longer shown on the main page, although it did have more prominence in V3. Now it is relegated to the History Page, with the introduction:
"For historical reasons we also maintain a calculation of the anomalies that would result if one only used the meteorological station data. This estimate is not affected by issues in ocean data processing, but because the land is warming faster than the ocean, it has a larger trend than the land-ocean index that is now our standard product. That too has been remarkably stable over the years:"
And with that, they give, as they do with LOTI, a plot of the data as it had been presented at various stages of GISS history, going back in fact to 1981. You can see both plots of the curves together, and their differences from current. And indeed the differences are small, especially recently.
The "historical reasons" are that, until about 1995, there didn't exist a dataset of sea temperatures of anything like the duration of the land record. So when Hansen and Lebedeff in 1987 published the ancestor of the GISS index, they used whatever station data they could get to estimate surface temperature over the oceans as well as land. Islands had a big role there. This index, called Ts, or GLB.Ts, was their main product until the mid '90's, when it was gradually supplanted by LOTI, using ocean sea surface temperatures (SST) as needed, as they became available backward in time.
Update. As CCE notes in comments, with GISS V4, the Ts index is not only relegated to the History page; it is not calculated in V4 at all. The numbers I have used are the latest V3.
GISS Land
However, Paul insisted that there was a land index, and pointed to the
Analysis Graphs and Plots page. If you scroll down to the heading "Annual Mean Temperature Change over Land and over Ocean" and open, it shows a plot of anomalies over land and over ocean, and below it gives links to data.
Now this is something different to GISS Ts. It also uses station data, but to estimate the average for land only. All such averages are area-weighted, but here is is just by land area. So from being very heavily weighted, island stations virtually disappear, since they represent little land. And the weighting of coastal stations is much diminished, since they too in Ts were weighted to represent big areas of sea.
The important message here is that Ts and Land are not the same, which I will now show with some graphs. Data is sourced and linked at the bottom.
Recent History, 2017 and 2019
Tony Heller provided a spreadsheet with his post, and it had the GISS data for versions of Ts up to 2017, and the Land data for 2019. I have described details of this
here and following. But GISS Ts does of course go to present (May 2019), which is regularly posted
here. And you can get past versions of the Land average plots with data on the Wayback Machine -
here is version of Jan 2017. So let's look at annual Ts, with 5 year running smoothing:

They are actually very similar. I'll givea combined difference plot later. What about Land?

Not quite as close, but also similar. The main difference is that pre-1900 is warmer in the current version, reducing the trend since 1880 from 1.05 °C/century to 1.0 °C/century. The trend of Ts also reduced slightly. Not much sign of data tampering here! In fact, given the number of extra stations in GHCN V4, there is remarkably little change.
Now I'll plot the Ts and Land averages superimposed on Tony Heller's "tampering" plot. But because the 2017 and 2019 versions are so similar, the plot gets cluttered. To make better use of space, I have truncated some of the big colorful annotations. I'll plot just the 2017 version of Ts and the 2019 version of Land. Not coincidentally, these are the versions of each found in Tony's spreadsheet.

They superimpose exactly! What has been presented as a "tampering" is in fact a plot of two different datasets, representing two different things. To emphasise that, I'll now plot 2019 versions of both Land and Ts:

Also a very good fit. The difference between the red and the green curve isn't "tampering" over time. It's the same difference if you take the current versions. They are just two different datasets representing two different things.
Getting it right.
As mentioned, I originally set this out in
comments at Clive Best's site, where Paul Matthews first raised the Tony Heller post. I then noted that at that (Heller's) site, a
commenter Genava had observed that the 2019 data plotted was different from the 2019 Ts data, which was the index of the 2001 and 2017 versions. That was on June 27. It got no response until Paul, probably prompted by my mention, said that the 2019 data was current Land data. I don't think he appreciated the difference between Land and Ts, so I commented June 28 to try to explain, as above. Apart from a bit of routine abuse, that is where it stands. No-one seems to want to figure out what is really plotted, and comments have dried up. Meanwhile the Twitter thread castigating "tampering" just continues to grow.
Data
The data plotted are year versions of the GISS Ts Met Stations Only index and the GISS annual data for Land Averages. The sources are, in ascii format:
GISS T2 current (2019) version
GISS T2 historic, includes 2017 version in zip file
Land average current, csv format
Land Average 2017 wayback version, txt
The data I used are in a .csv file
here.




 Posts

