Wednesday, January 30, 2019

December global surface TempLS up 0.12°C from November.

The TempLS mesh anomaly (1961-90 base) was 0.748deg;C in December vs 0.628°C in November. That continues the recent up-down alternation, and makes it the third warmest December in the record (near tie with 2017 for 2nd). The GHCN results were delayed by the US government hiatus.

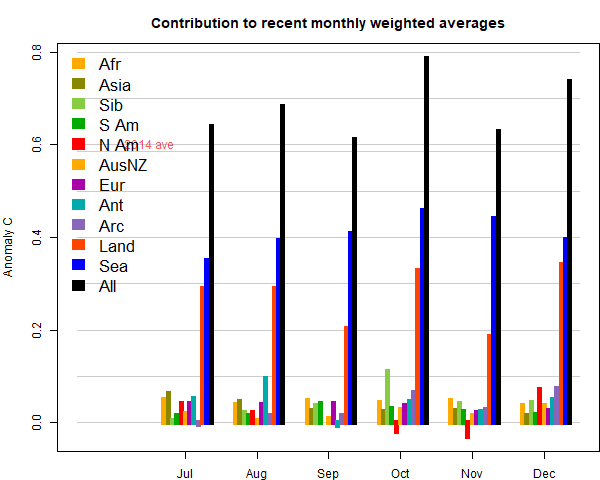
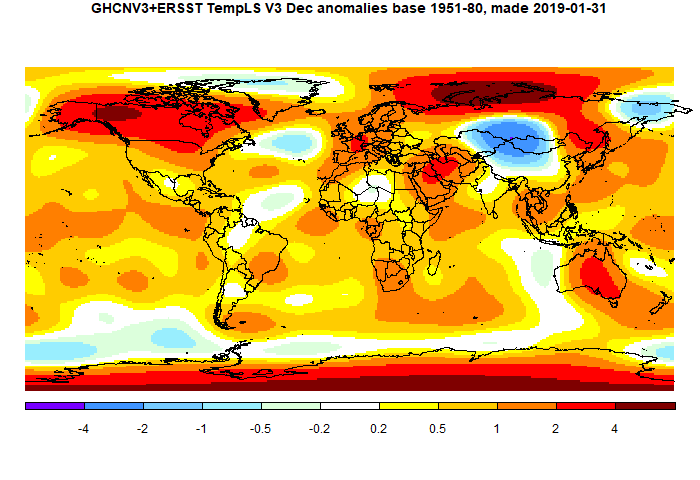
Significantly, for the second month in a row, SST was down, after a few months of rise. But land temperatures were generally higher. The big contributors to this were N America and the Arctic. Almost everywhere was warm, including Europe and Australia. A cool patch in mid-Siberia/Mongolia.
Here (from here) is the plot of relative contributions to the rise (ie components weighted by area):

Here is the temperature map. As always, there is a more detailed active sphere map here.


Saturday, January 12, 2019

December global surface anomaly up 0.038°C from November - ECMWF reanalysis

Usually I would have my analyses out by now, but as explained, the data I need is not available yet due to the US government shutdown. I'll post, with 2018 discussion, when they are available. However, the ECMWF, via Copernicus, is not subject to that shutdown, and their reanalysis data is out. A CSV listing of monthly global and European surface average is here. Relative to 1981-2010, November was 0.430°C; December was 0.468°C.

A description of relevant ECMWF data on average monthly temperature is here.

I won't try to summarise the features of the month; ECMWF has a very detailed description in their December report. I'll just show their map, which includes Europe too:


The ECMWF also reports on the year's result; 2018 was the fourth warmest year in the record, after 2016, 2017, 2015. Details and links here. Most surface records including TempLS will report the same ranking.


Tuesday, January 1, 2019

Happy New Year (and update on shutdown consequences for data).

Wishing all readers the best for 2019, even if it doesn't look so promising right now.

Usually about this time I am gathering data for articles about 2018. But the US government shutdown has now closed down most NOAA sites, and it doesn't look like ending anytime soon. The first affected will be the NCEP/NCAR reanalysis index. But GHCN a,d ERSST are out too, so that cuts out TempLS, on which I would normally report by about the 8th. So fingers crossed.

The last NCEP/NCAR data was from 23rd Dec.AT that stage, there had been a big warm peak, and DEcember was looking to be a very warm month. However, that was passing, so the end result is likely to be cooler, althoug still a lot warmer than November.


Tuesday, December 18, 2018

GISS November global down 0.21°C from October.

The GISS land/ocean temperature anomaly fell 0.21°C last month. The November anomaly average was 0.77°C, down from October 0.98°C. A big fall, exceeding the TempLS fall of 0.163°C. Both indices reversed a very similar rise in October. Jim Hansen's report is here.

The overall pattern was similar to that in TempLS. Cold in Canada and US, except W Coast. Warm in E Siberia and Alaska, and most of Arctic except near Canada. Quite warm in Europe and Africa. A warm band in the equatorial Pacific.

As usual here, I will compare the GISS and previous TempLS plots below the jump.

Saturday, December 8, 2018

November global surface TempLS down 0.161°C from October.

The TempLS mesh anomaly (1961-90 base) was 0.623deg;C in November vs 0.784°C in October. That reverses the warming last month, making it the coolest November since 2014. The NCEP/NCAR index also fell by 0.122°C, while the UAH satellite TLT index rose 0.06°C. The reanalysis showed most of the surface fall was in a cold spell mid-month.

The main cold region was N America (except west coast/Alaska), extending up through the Arctic archipelago. Elsewhere Europe was warm, extending into Africa. Also Alaska/E Siberia.
Here (from here) is the plot of relative contributions to the rise (ie components weighted by area):

Here is the temperature map. As always, there is a more detailed active sphere map here.


Monday, December 3, 2018

November NCEP/NCAR global surface anomaly down 0.122°C from October

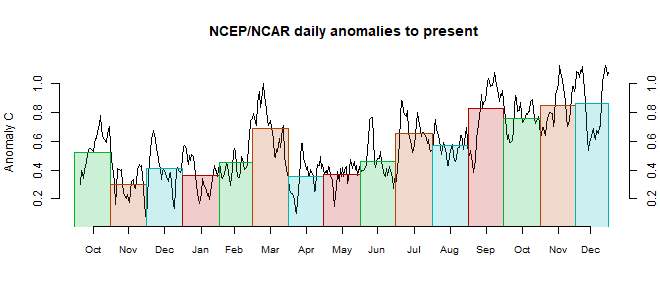
In the Moyhu NCEP/NCAR index, the monthly reanalysis anomaly average was 0.176°C in November, down from 0.298°C in October, 2018. The fall follows a slightly smaller rise in October, and makes November the coolest month since July 2015. The month started and ended fairly warm, but there was a deep dip mid-month.

The main cold region was N America, except W Coast, but extending right up through the Arctic Archipelago. There were warm patches over Alaska and far N Atlantic/Scandinavia. Cool over a lot of Russia, warm Africa. Antarctica mixed, but a lot of cold. A noticeable El Niño warm jet.

The BoM El Niño alert continues.


Friday, November 16, 2018

GISS October global up 0.25°C from September.

The GISS land/ocean temperature anomaly rose 0.29°C last month. The October anomaly average was 0.99°C, up from September 0.74°C. A big rise, exceeding the TempLS rise of 0.166°C. Like TempLS it was the second warmest October in the record, but it was even fairly close to the highest, the the El Nino value 0f 1.08 in 2015. Jim Hansen's report is here.

The overall pattern was similar to that in TempLS. Very warm in Siberia, but extending through the Arctic (which is probably why warmer than TempLS). Cold in Canada and US prairies. Quite warm in Europe, patchy in Antarctica.

As usual here, I will compare the GISS and previous TempLS plots below the jump.