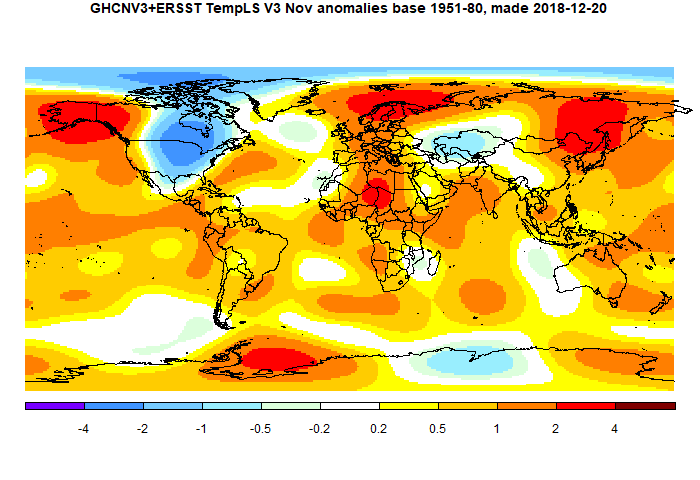
The overall pattern was similar to that in TempLS. Very warm in Siberia, but extending through the Arctic (which is probably why warmer than TempLS). Cold in Canada and US prairies. Quite warm in Europe, patchy in Antarctica.
As usual here, I will compare the GISS and previous TempLS plots below the jump.
Here is GISS

And here is the TempLS spherical harmonics plot
This post is part of a series that has now run for six years. The GISS data completes the month cycle, and is compared with the TempLS result and map. GISS lists its reports here, and I post the monthly averages here.
The TempLS mesh data is reported here, and the recent history of monthly readings is here. Unadjusted GHCN is normally used, but if you click the TempLS button there, it will show data with adjusted, and also with different integration methods. There is an interactive graph using 1981-2010 base period here which you can use to show different periods, or compare with other indices. There is a general guide to TempLS here.
The reporting cycle starts with a report of the daily reanalysis index on about the 4th of the month. The next post is this, the TempLS report, usually about the 8th. Then when the GISS result comes out, usually about the 15th, I discuss it and compare with TempLS. The TempLS graph uses a spherical harmonics to the TempLS mesh residuals; the residuals are displayed more directly using a triangular grid in a better resolved WebGL plot here.
A list of earlier monthly reports of each series in date order is here:


Well, there went around a dozen or so theories on the imminent onset of global cooling.
ReplyDeleteI believe that this very high number for GISS October is provisional and quite uncertain. A lot of countries in South America and Afrika, plus Kazakhstan are missing in the analysis, see https://data.giss.nasa.gov/gistemp/stdata/
ReplyDeleteThe difference to TempLS is probably that GISS doesn't let SST infill the Arctic Ocean. The northernmost reporting land stations have anomalies of 4-10 C, but SST in the Arctic ocean that dominates the TempLS infilling are not that warm.
I tried to Post in Prospects for 2018, but this still not work. Same problem as before.
ReplyDeleteSo I update my prediction here.
I reimplemented the Algorithm so there it improves compared to that one used the last 7 months.
I update my prediction for GISS temperature anomaly using data up to Oct18.
SON18 0.86+-0.06
J-D18 0.82+-0.03
DJF19 0.88+-0.20
MAM19 0.93+-0.19
JJA19 0.89+-0.15
(SON19 1.00+-0.16)
(J-D19 0.94+-0.13)
For the last both values I assumed that the prediction for 2018 turns out exactly.
Additional MEI prediction, experimental
OctNov18 +0.50+-0.34
NovDec18 +0.42+-0.48
DecJan19 +0.51+-0.61
JanFeb19 +0.55+-0.85
Uli,
DeleteYes, I currently have moderation set on old posts. I have approved it, so it will appear there as well.