Tuesday, January 9, 2024

Graphics to show magnitude of 2023 warming.

My previous post, with the December anomaly average, completed the years results and confirmed what has been obvious for a while, that 2023 is the hottest year that has been measured. It was 0.158°C warmer than 2016, the next warmest year, which itself stood above previous years.

I'd like here to collect some graphics which will put this into proportion. It comes from a collection (for various indices) that I am updating and posting on the data page. The first is oneof a kind that I show whenever there is a record year. It is just a bar chart of the temperatures, but colored in a way that shows the progress of the record values:

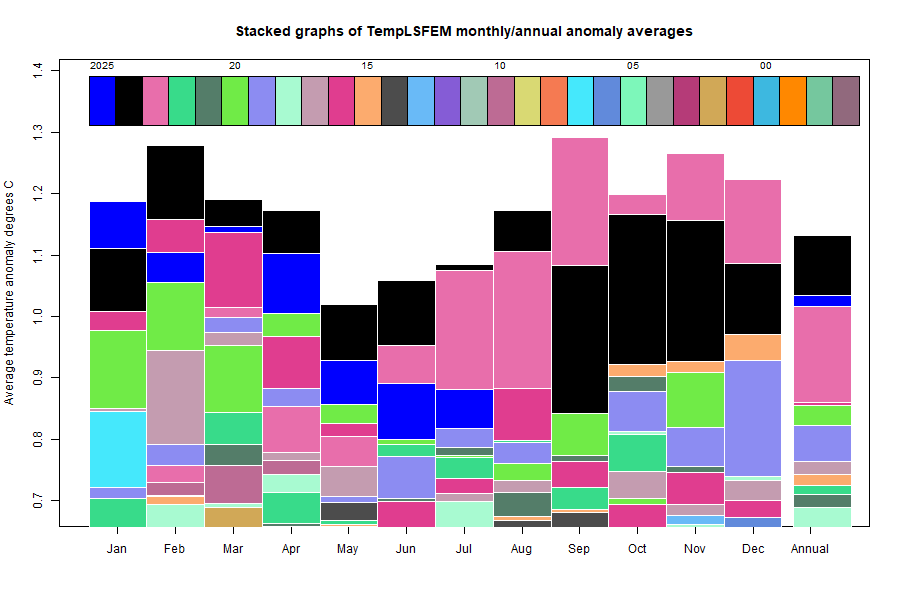
The second is one that I have been showing for a while. It is a stacked graph of monthly and annual temperatures. It is like a bar chart, but the months have been gathered in one slot, and arranged in order of size, tallest at the back. Annual is shown as well. Since June, 2023 towers over the rest:
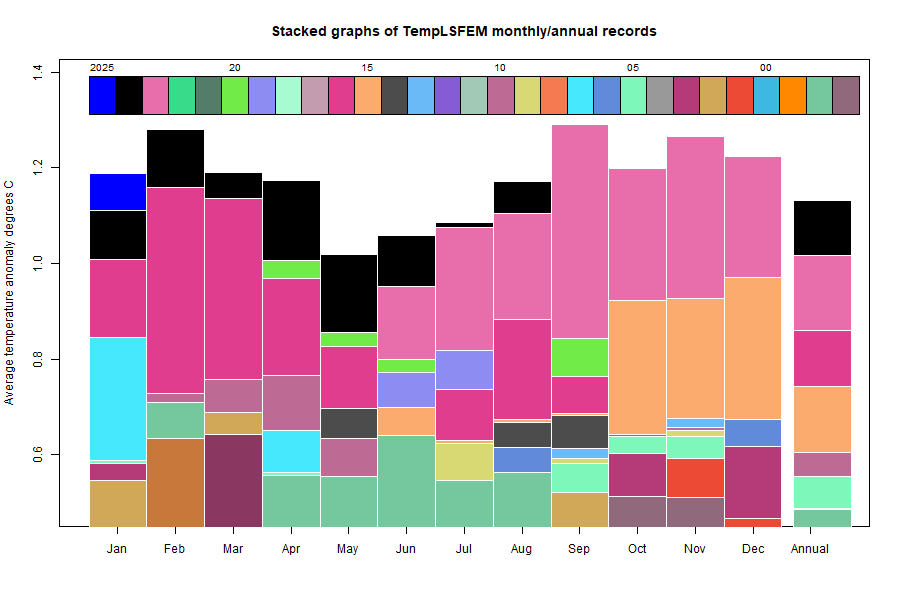
And here is a graph with a different ordering, by time, newest at the back. Each rectangle you now see was a record in its time, so gives an idea of how record setting 2023 was. 2016 was not so far behind, but based on just four very warm months. However, there is a calendar effect here. The 2015/6 peak was split between two years; taken together, they were actually larger than 2023, as you see from the annual column. Still, the current one isn't finished by any means.
Monday, January 8, 2024

December global surface TempLS down 0.064°C from November, but still warmest December in record.

The TempLS FEM anomaly (1961-90 base) was 1.214°C in December, down from 1.278°C in November. It was still by far the warmest December in the record by 0.229°C, ahead of 0985°C in 2015. The NCEP/NCAR reanalysis base index rose by 0.031°C.

It confirms 2023 as the hottest year in the record; I'll write more about that with graphics in a coming post. I have added a gallery of graphics to the data page here. For now, I'll just show the stacked graph of monthly temperatures, to show how the last seven months stand out:

Here is the corresponding stacked graph, showing how much hotter recent months have been, as well as the now completed year of 2023:


North America was very warm. Scandinavia was cold, as was a section of East Siberia. Antarctica was cold.
Here is the temperature map, using the FEM-based map of anomalies. Use the arrows to see different 2D projections.


As always, the 3D globe map gives better detail. There are more graphs and a station map in the ongoing report which is updated daily.

Friday, December 15, 2023

GISS November global temperature up by 0.1°C from October.

The GISS V4 land/ocean temperature anomaly was 1.44°C in November 2023, up from 1.34°C in October. This rise is similar to the 0.061°C rise reported for TempLS.

As with TempLS, November was by a large margin the warmest November in the record - next was 1.1°C in 2020. It was the second warmest month of all kinds; just 0.03°C less than last September.

As usual here, I will compare the GISS and earlier TempLS plots below the jump.

Tuesday, December 5, 2023

November global surface TempLS up 0.061°C from October.

The TempLS FEM anomaly (1961-90 base) was 1.267°C in November, up from 1.206°C in October. It was by far the warmest November in the record by 0.337°C, ahead of 0.93°C in 2015, and it was very nearly the warmest month of any kind, after last September at 1.285°C. The NCEP/NCAR reanalysis base index rose by 0.09°C.

The average for 2023 to date is 0.995°C, well ahead of 2016 at 0,855°C. I'll show again the table of months in descending order of warmth:


Here is the corresponding stacked graph, showing how much hotter recent months have been

 
 Most of the world was warm, with the main cool spots being Scandinavia and East Antarctica.

Here is the temperature map, using now the FEM-based map of anomalies.


As always, the 3D globe map gives better detail. There are more graphs and a station map in the ongoing report which is updated daily.

Thursday, November 16, 2023

GISS October global temperature down by 0.13°C from September.

The GISS V4 land/ocean temperature anomaly was 1.34°C in October 2023, down from 1.47°C in September. This fall is similar to the 0.1°C fall reported for TempLS.

As with TempLS, October was by a large margin the warmest October in the record - next was 1.02°C in 2016. It was nearly the second warmest month of all kinds; just pipped by Feb/Mar of 2016.

As usual here, I will compare the GISS and earlier TempLS plots below the jump.

Tuesday, November 7, 2023

October global surface TempLS down 0.102°C from September.,still second warmest month.

The TempLS FEM anomaly (1961-90 base) was 1.182°C in October, down from 1.284°C in September. It was still the warmest October in the record by 0.26°C well ahead of 0924°C in 2015, and it wass till, after September, the warmest month of any kind. The NCEP/NCAR reanalysis base index fell by 0.069°C.

The average for 2023 to date is 0.966°C, well ahead of 2016 at 0,855°C. I'll show again the table of months in descending order of warmth:


Here is the corresponding stacked graph, showing how much hotter recent months have been

Most of the world was warm, with the only cool spots being Scandinavia and areas of Antarctica. Very warm in central Siberia.

Here is the temperature map, using now the FEM-based map of anomalies.


As always, the 3D globe map gives better detail. There are more graphs and a station map in the ongoing report which is updated daily.

Sunday, October 8, 2023

September global surface TempLS up 0.191°C from August. Record warm month.

The TempLS FEM anomaly (1961-90 base) was 1.292°C in September, up from 1.101°C in August. It was by far (by 0.45°C! ) the warmest September in the record well ahead of 0.842°C in 2020. It was the warmest month of any kind by a margin of 0.14°C (Feb 2016). The NCEP/NCAR reanalysis base index rose by 0.25°C.

That makes four very warm months in a row, and the recent warmth makes it almost certain that 2023 will be the warmest year in the record. The average to date is 0.946°C, well ahead of 0.857°C in 2016. But unlike 2016, 2023 is getting warmer, while 2016 peaked in Feb-Mar. I'll show the stacked plot of months in descending order of warmth:


The table from which it is derived is here.

Most of the world was warm, with the only cool spot being an area around Patagonia. Europe was quite warm.

Here is the temperature map, using now the FEM-based map of anomalies. Use the arrows for different projections.


As always, the 3D globe map gives better detail. There are more graphs and a station map in the ongoing report which is updated daily.