I have two topics - the history of wildfire in the US, and a particular fire in Victoria in 1851. When people start to wonder about whether fires are getting worse in the US, as they seem to be, then a graph is trotted out to show how much worse things were in the 1930's. And if there is a bad fire in Australia, the 1851 fire is said to be so much worse. This is all to head off any suggestion that AGW might be a contributor.
I'll start with the US story. The graph that appears is one like this:
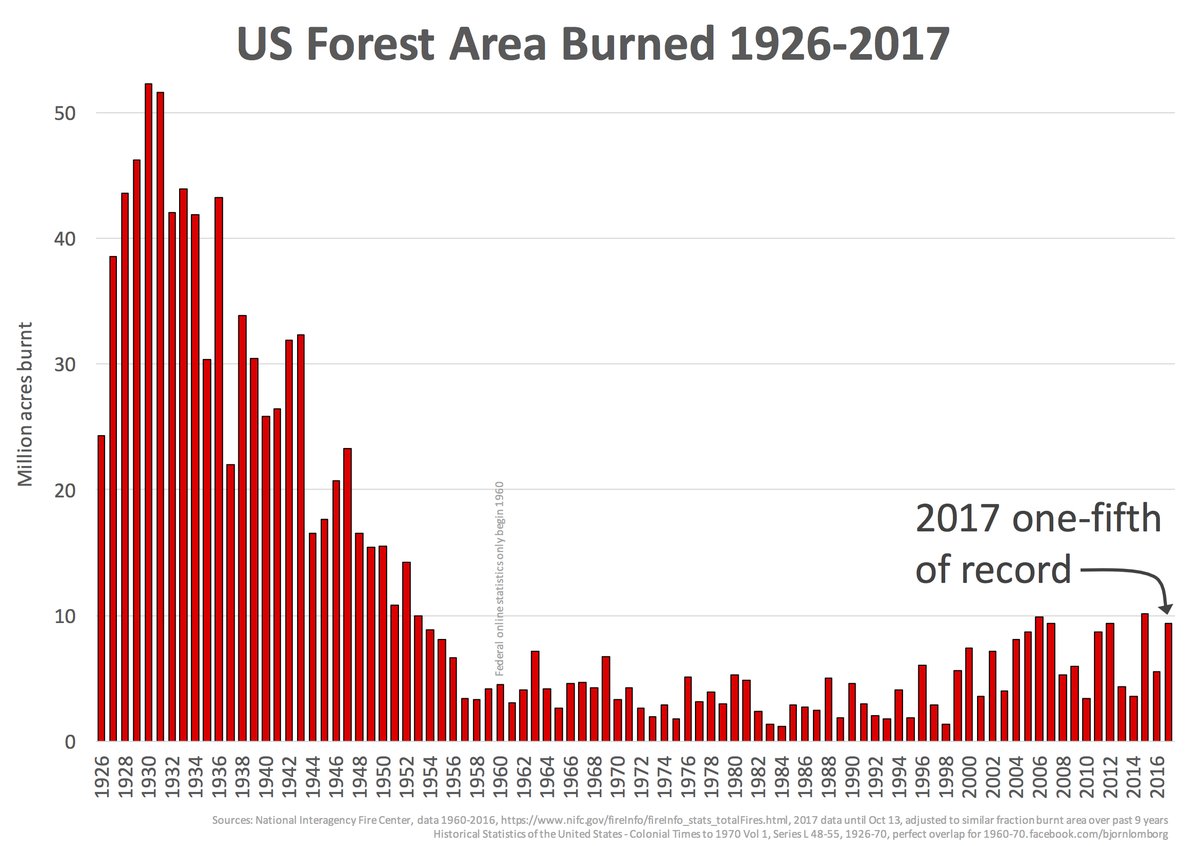
This appeared in a post by Larry Kummer a few days ago. He gave some supporting information, which has helped me to write this post. I had seen the plot before, and found it incredible. The peak levels of annual burning, around 1931, are over 50 million acres, or 200,000 sq km. That is about the area of Nebraska, or 2.5% of the area of ConUS. Each year. It seems to be 8% of the total forest area of ConUS. I'm referring to ConUS because it was established that these very large figures for the 1930's did not include Alaska or Hawaii. It seemed to me that any kind of wildfires that burnt an area comparable to Nebraska would be a major disaster, with massive loss of life.
So maybe the old data include something other than wildfires. Or maybe they are exaggerated. I wanted to know. Because it is pushed so much, and looks so dodgy, I think the graph should not be accepted.
Eli has just put up a post on a related matter, and I commented there. He helpfully linked to previous blg discussions at RR and ATTP
Larry K, at JC's, traced the origin of the graph to a 2014 Senate appearance by a Forestry Professor (Emeritus), David South. He is not a fan of global warming notions. Rather bizarrely, he took the opportunity of appearing before the Senate committee to offer a bet on sea level:
"I am willing to bet $1,000 that the mean value (e.g. the 3.10 number for year 2012 in Figure 16) will not be greater than 7.0 mm/yr for the year 2024. I wonder, is anyone really convinced the sea will rise by four feet, and if so, will they take me up on my offer?"
Prof South's graph did not come from his (or anyone's) published paper; he has not published on fire matters. But it was based on real data, of a sort. That is found in a document on the census site: Historical Statistics of the United States p537. That is a huge compendium of data about all sorts of matters. Here is an extract from the table:

As you can see, the big numbers from the 30's are in "unprotected areas". And of these, the source says:
"The source publication also presents information by regions and States on areas needing protection, areas protected and unprotected, and areas burned on both protected and unprotected forest land by type of ownership, and size of fires on protected areas. No field organizations are available to report fires on unprotected areas and the statistics for these areas are generally the best estimates available."
IOW, an unattributed guess. That that is for the dominant component. Federal land fires then are basically less than modern.
The plot mostly in circulation now, and shown by Larry K above, is due to a Lomborg facebook post.
The organisation currently responsible for presenting US fire history statistics is the National Interagency Fire Center. And their equivalent table lists data back to 1960, which pretty much agrees where it overlaps with the old census data to 1970. But they rather pointedly go back no further. And at the bottom of the table, they say (my bold):
"Prior to 1983, sources of these figures are not known, or cannot be confirmed, and were not derived from the current situation reporting process. As a result the figures above prior to 1983 shouldn't be compared to later data."
So not only do they not show data before 1960; they advise against comparison with data before 1983.
Interestingly, ATTP noted that a somewhat similar graph appeared on a USDA Forest Service at this link. It now seems to have disappeared.
I think these graphs should be rejected as totally unreliable.
The Victorian Bushfires of 1851.
First some background. Victoria was first settled in 1834, mainly around Melbourne/Geelong (Port Phillip District), with a smaller area around Portland in the West. In Feb 1851, the time of the fires, the region was still part of the colony of New South Wales. Two big events to come later in the year were acquiring separate colony status, and the discovery of gold, which created a gold rush. But in Feb, the future colony had about 77,000 people, mainly around Melbourne/Geelong. There were no railways or telegraphs, and no real roads outside that region.There undoubtedly was a very hot day on Thursday Feb 6, 1851, and the populated area was beset with many fires. It may well have been the first such day in the seventeen years of the region, and it made a deep impression. This site gathers some reports. But the main furphy concerns claims of statewide devastation. Wiki has swallowed it:
"They are considered the largest Australian bushfires in a populous region in recorded history, with approximately five million hectares (twelve million acres), or a quarter of Victoria, being burnt."
A quarter of Victoria! But how would anyone know? Nothing like a quarter of Victoria had been settled. Again, virtually no roads. No communications. Certainly no satellites or aerial surveys. Where does this stuff come from?
It is certainly widespread. The ABS, (our census org) says
" The 'Black Thursday' fires of 6 February 1851 in Victoria, burnt the largest area (approximately 5 million ha) in European-recorded history and killed more than one million sheep and thousands of cattle as well as taking the lives of 12 people (CFA 2003a; DSE 2003b)"
It is echoed on the site of the Forest Fire Management (state gov) .The 1 million sheep (who counted them?) and 12 people are echod in most reports. But the ratio is odd. People had very limited means of escape from fire then, and there were no fire-fighting organisations. No cars, no roads, small wooden dwellings, often in the bush. Only 12, for a fire that burnt a quarter of Victoria?
The ABS cites the CFA, our firefighting organisation. I don't know what they said in 2003, but what they currently list is the 12 people killed, and 1000000 livestock, but not the area burnt.
By way of background, here is a survey map of Victoria in 1849. The rectangles are the survey regions (counties and parishes). It is only within these areas that the Crown would issue title to land. That doesn't mean that the areas were yet extensively settled; the dark grey areas are currently purchased. I think even that may be areas in which there are purchases, rather than the area actually sold.

There are a few small locations beyond - around Horsham in the Wimmera, Port Albert, in Gippsland, Portland, Kyneton and Kilmore. This is a tiny fraction of the state. So even if a quarter of the state had burnt, who would be in a position to assess it?
So what are the original sources? Almost entirely a few newspaper articles. Here is one from the Melbourne Argus, on Monday 10th Feb, four days after the fire. They explain why they judiciously waited:
"In our Saturday's issue we briefly alluded to the extensive and destructive bush fires that prevailed throughout the country, more particularly on the Thursday preceding. Rumours had reached us of conflagrations on every side, but as we did not wish to appear alarmists, we refrained from noticing any but those that were well authenticated, knowing how exceedingly prone report is to magnify and distort particulars. Since then, however, we learn with regret that little only of the ill news had reached us, and that what we thought magnified, is unhappily very far from the fearful extent of the truth."
And they give an exceedingly detailed listing of damages and losses, but all pretty much within that surveyed area. A large part of the report quotes from the Geelong Advertiser. There is a report from Portland, but of a fire some days earlier. Many of the fires described are attributed to some local originating incident.
There is an interesting 1924 account here by someone who was there, at the age of 12 (so now about 85). It gives an idea of how exaggerated notions of area might have arisen. He says that the conflagration extended from Gippsland northward as far as the Goulburn river. But even now, a lot of that country is not much inhabited. It's pretty clear that he means that fires were observed in Gippsland (a few settlements) and the Goulburn (probably Seymour).
So again, where does this notion of 5 million hectares come from? I haven't been able to track down an original source for that number, but I think I know. Here (from here) is a common summary of the regions affected "'Fires covered a quarter of what is now Victoria (approximately 5 million hectares). Areas affected include Portland, Plenty Ranges, Westernport, the Wimmera and Dandenong districts. Approximately 12 lives, one million sheep and thousands of cattle were lost'"
Those are all localities, except for the Wimmera, which is a very large area. But the only report from Wimmera is of a fire at Horsham, virtually the only settled area. Another formulation is from the CFA:
"Wimmera, Portland, Gippsland, Plenty Ranges, Westernport, Dandenong districts, Heidelberg."
Apart from the western town Portland, and "Wimmera", the other regions are now within the Melbourne suburbs (so they left out Geelong and the Barrabool ranges, which seems to have been seriously burnt). So where could 5 million hectares come from? I think from the reference to Wimmera. Some reports also list Dandenong as Gippsland, which is a large area too. I think someone put together the Wimmera, which has no clear definition, but Wiki puts it at 4.193 million hectares. With a generous interpretation of Westernport and Portland, that might then stretch to 5 million hectares. But again, Wimmera has only one settled location, Horsham, where there was indeed a report of a fire.


> wiki
ReplyDeleteWell, I did my best: https://en.wikipedia.org/w/index.php?title=Black_Thursday_bushfires&diff=816182569&oldid=811686001 I don't know if it will last.
> In Feb 1951, the time of the fires
Typo
Thanks, I hope it lasts. But that furphy is pretty well entrenched.
Delete1851 fixed.
Problem is that unprotected areas were exactly that, and the numbers did not include Alaska and Hawaii until quite late (they were not states until the 1950s).
ReplyDeleteThere is a lot of evidence that forest cover in the Western US has dramatically increased in the last 50 years due to fire suppression. In the UC Boulder physics building are old photos of the flatirons and there are only a few trees. Today the area is heavily forested with Ponderosa Pines. There is other evidence in other archived photos in Colorado during the gold rush era. This seems to me to show that it is likely that indeed before effective fire suppression, large areas were regularly burned.
ReplyDeleteOther admittedly anecdotal evidence. Here in Western Washington (where fires in the recent fire suppression era are rare), in my back yard there are charred red cedar stumps. We cut down a large Douglas Fir tree and the inner 10 rings were surrounded by a charred layer and then perhaps 80 additional annual rings. You can find this evidence all over the Issaquah Alps and can look at old photos indicating that in the 1920's and 1930's there were large forest fires. At that time, no one cared and no action was taken to suppress them. One can find such evidence throughout the American West. In Eastern Washington, it seems plausible that large forest fires were very common before modern fire suppression. You will find very large tracts of forrest whose age is roughly 70-90 years.
ReplyDeleteDavid,
DeleteMy objection to the graph is that the numbers in 1930's are unbelievably high. 50 million acres is larger than the whole of Washington state. And that is the amount said to be burnt each year around 1931. It's certainly possible that the amount burnt then was higher than now - on current facts, we can't know. The point of the exercise, of course, is to see if climate warming is a cause. For that, the effect of varying suppression would need to be separated. If fires are increasing despite our efforts at suppression, it isn't much consolation to know that they were worse when no suppression was done.
The forest area has increased since 1930, but not much, according to the table on p 8 here. 721 million ac res in 1920, 766 million acres in 2012. Of course it is possible that forest diminished by burning is included in the total. But again, 50 million acres is 1/15 of that total. That would average about 15 years between burnings.
This seems like a pretty complex topic, and so not one well suited for AGW type studies. Like Nick, I think the statistics prior to federal tracking are pretty suspect, if for no other reason than the extreme size of the areas being reported. Even if they are "accurate" in some sense, there's no reason to assume the assay method was the same, which makes comparison of the two periods highly questionable.
ReplyDeletePeople have mentioned attempts at controlling fires. That can explain why the amount of area burned decreased for some periods, but it could also explain why fires could, over time, become harder to control:
The increase in tree litter on the forest floor provides for more fire tender, and also provides areas for insect populations to thrive (which damage the trees over time, making them more vulnerable to fire).
As a response to this, we have actively started setting fires in the hopes to destroy some of this accumulated tree litter. This could lead to a larger net area burned, even if the scope of the typical fire is actually lower (when averaged on a per-acre basis).
The other thing I can think of is the increased human population density in these areas. This acts as an impediment to traditional fire control methods, which involve containing a fire, and allowing it to burn out. Instead, fire fighters are forced to try and intervene in fires to prevent the destruction of human property.
While you might be able to use both strategies at the same time, you're likely going to need to double the number of fire fighters and fire fighting equipment to run both strategies at the same time.
Again given all of the differences over time, this seems to be an ill-suited topic for inclusion in climate change studies, except by the people are trying to sensationalize the story.
Carrick,
DeleteI agree that it is difficult, but I also think the question of whether fires are getting worse in very recent decades is important, and there is better information there. It is an issue here, because our eucalypt forests burn very badly when the tempeature gets to 45°C or so. That doesn't happen often, but it did in 2009, a record high, and we lost most of two towns. That 1 fire burnt in a few hours an area about three times as large as the Thomas fire. So, well, the prospect of maybe getting worse is alarming.
We did do fairly extensive preventive burning for a decade or two, but there was an accumulation of incidents where the prescribed burns caused damage. I think they were net beneficial, by a long way, but it's hard to convince people of that, and more importantly, the quantity of blame means that no-one wants to risk it. So that has been fading. It could be a factor in recent troubles, but the marginal effect of temperature in the 45° range seems so great that I think preventive measures get overwhelmed.
I was in CA recently and a farmer said people think fires are about hot and dry and they are not they are about rain.
ReplyDeleteThe rains in CA a year or so ago are the cause of the fires. It is very dry in CA virtually every year and the fuel built during a rainy period takes time to fall and decay. Small fire while the areas dry help to break the regions of high fuel up and protect against the now quite usual very serious fires.
The CAGW claims regarding cause may have fact but the dominant process is fire suppression. Historical reporting was likely wrong but 5X wrong?
I'd missed this discussion earlier, but in the spirit of better late than never I'll repost a comment I made at ATTP in Oct 2015 (https://andthentheresphysics.wordpress.com/2015/10/12/show-me-slowly-what-i-only-know-the-limits-of/#comment-64741). These figures are 1) poorly documented; 2) clearly comparing apples to oranges and 3) possibly reflecting the prevalence of some form of slash and burn agricultural practices in the early 1900s.
ReplyDeleteWhen comparing trends, whether of rare extreme events or not, it’s critical to ensure the validity of older data and ensure that one is comparing apples to apples.
The graph noted towards the end of ATTP’s post is from a June 2011 USDA Forest Service report (see http://www.fs.fed.us/research/sustain/national-report.php). The data is likely taken from the agency’s own databases, however (without assigning any blame to the report’s authors) the data seems doubtful.
From 1931-1954, the annual burn rates (yearly burn area/forest area) for the United States excluding Alaska are as follows:
Protected federal lands 0.22% (range 0.05% to 0.41%)
Protected state and private forests 0.99% (range 0.42% to 1.45%)
Unprotected state and private forests 15.9% (range (10.7% to 21.2%)
(From Table No. 708, Statistical Abstract of the United States 1956, plus data for 1931-1932 from previous reports)
https://play.google.com/books/reader?id=FLi4OJU8QYsC&printsec=frontcover&output=reader&hl=en_GB&pg=GBS.PA708
Given the crude firefighting equipment and resources available during the 1930s to early 1950s, a >70-fold difference in burn rates between protected federal forests and unprotected forests maintained over a quarter-century seems literally unbelievable. It’s impossible to see how unprotected forests could possibly have had, and sustained, burns of 15 to 20% of their total area, year after year, by any current definition of wildfire.
Or maybe federal organizations deliberately fiddled with the numbers. Both because of a perceived need to halt wasteful (in the view of the time) and dangerous wildfires as well as the rapid expansion of federal agencies in the post-World War I and Depression eras, the Forestry Service aggressively lobbied to expand its size and mandate in the early 1930s. (Around the same time the U.S. Army Corps of Engineers and its rival the Bureau of Reclamation) did much the same with respect to building dams wherever and however they could.)